510 W Oak St Celina, TX 75009
Estimated Value: $284,000 - $352,000
2
Beds
2
Baths
1,052
Sq Ft
$292/Sq Ft
Est. Value
About This Home
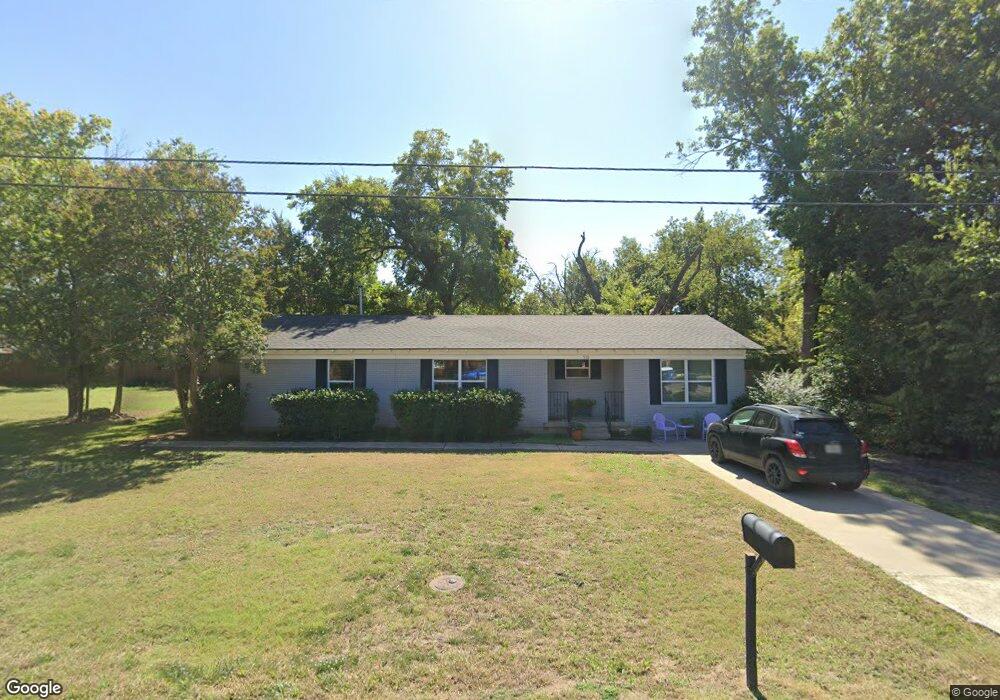
This home is located at 510 W Oak St, Celina, TX 75009 and is currently estimated at $307,289, approximately $292 per square foot. 510 W Oak St is a home located in Collin County with nearby schools including Celina Primary School, Marcy B. Lykins Elementary School, and Moore Middle School.
Ownership History
Date
Name
Owned For
Owner Type
Purchase Details
Closed on
Aug 7, 2018
Sold by
Mcllroy Martha
Bought by
Ragan Jeffrey Matthew and Ragan Wendy Jayne
Current Estimated Value
Purchase Details
Closed on
Jul 25, 2007
Sold by
Mccartney Kristina S
Bought by
Mcilroy Martha
Home Financials for this Owner
Home Financials are based on the most recent Mortgage that was taken out on this home.
Original Mortgage
$65,920
Interest Rate
6.71%
Mortgage Type
Purchase Money Mortgage
Purchase Details
Closed on
Mar 9, 2005
Sold by
Waldrep Mary K
Bought by
Mccartney Kristina S
Home Financials for this Owner
Home Financials are based on the most recent Mortgage that was taken out on this home.
Original Mortgage
$75,000
Interest Rate
5.66%
Mortgage Type
Purchase Money Mortgage
Purchase Details
Closed on
Aug 20, 1998
Sold by
Paschall Timothy Robin and Paschall Rebecca Gail
Bought by
Christiana Michael R and Christiana Suzanne A
Home Financials for this Owner
Home Financials are based on the most recent Mortgage that was taken out on this home.
Original Mortgage
$88,701
Interest Rate
6.9%
Mortgage Type
FHA
Create a Home Valuation Report for This Property
The Home Valuation Report is an in-depth analysis detailing your home's value as well as a comparison with similar homes in the area
Home Values in the Area
Average Home Value in this Area
Purchase History
| Date | Buyer | Sale Price | Title Company |
|---|---|---|---|
| Ragan Jeffrey Matthew | -- | None Available | |
| Mcilroy Martha | -- | Stnt | |
| Mccartney Kristina S | -- | -- | |
| Christiana Michael R | -- | -- |
Source: Public Records
Mortgage History
| Date | Status | Borrower | Loan Amount |
|---|---|---|---|
| Previous Owner | Mcilroy Martha | $65,920 | |
| Previous Owner | Mccartney Kristina S | $75,000 | |
| Previous Owner | Christiana Michael R | $88,701 |
Source: Public Records
Tax History Compared to Growth
Tax History
| Year | Tax Paid | Tax Assessment Tax Assessment Total Assessment is a certain percentage of the fair market value that is determined by local assessors to be the total taxable value of land and additions on the property. | Land | Improvement |
|---|---|---|---|---|
| 2025 | $5,449 | $282,408 | $198,000 | $84,408 |
| 2024 | $5,449 | $269,580 | $165,000 | $104,580 |
| 2023 | $5,449 | $300,352 | $132,000 | $168,352 |
| 2022 | $5,574 | $243,205 | $80,000 | $163,205 |
| 2021 | $3,573 | $153,013 | $36,000 | $117,013 |
| 2020 | $3,194 | $130,380 | $36,000 | $94,380 |
| 2019 | $3,384 | $132,849 | $36,000 | $96,849 |
| 2018 | $2,526 | $98,792 | $30,000 | $84,724 |
| 2017 | $2,297 | $121,488 | $30,000 | $91,488 |
| 2016 | $2,102 | $106,094 | $22,500 | $83,594 |
| 2015 | $1,498 | $91,553 | $22,500 | $69,053 |
Source: Public Records
Map
Nearby Homes