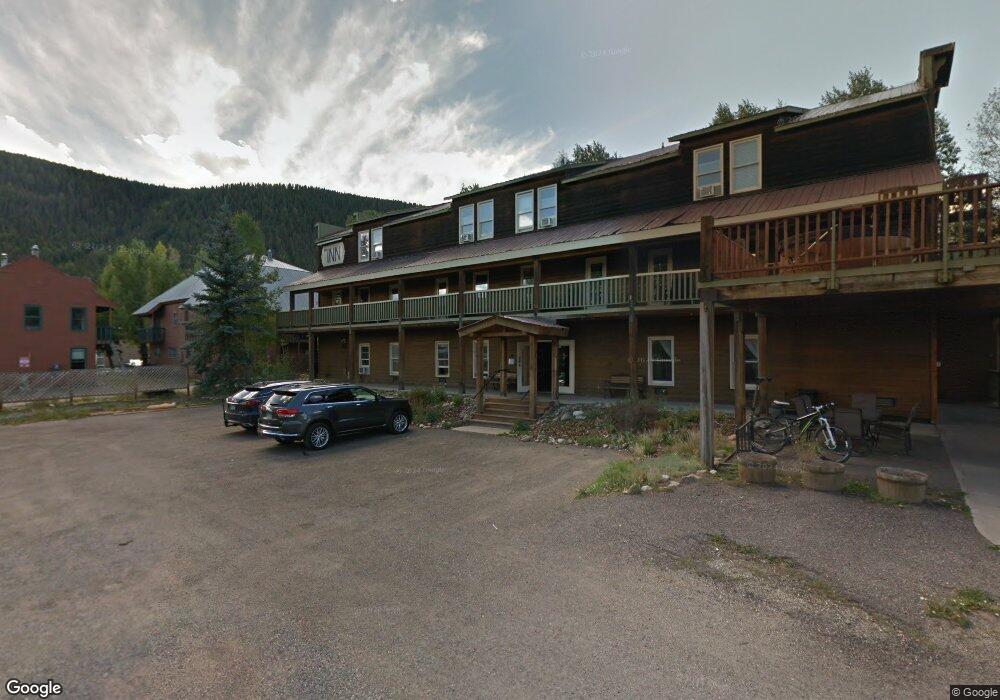
510 Whiterock Ave Unit PARTIAL INTEREST Crested Butte, CO 81224
Estimated Value: $3,468,989
1
Bed
9
Baths
8,892
Sq Ft
$390/Sq Ft
Est. Value
About This Home
This home is located at 510 Whiterock Ave Unit PARTIAL INTEREST, Crested Butte, CO 81224 and is currently estimated at $3,468,989, approximately $390 per square foot. 510 Whiterock Ave Unit PARTIAL INTEREST is a home located in Gunnison County with nearby schools including Gunnison Elementary School, Crested Butte Community School, and Gunnison Middle School.
Ownership History
Date
Name
Owned For
Owner Type
Purchase Details
Closed on
Apr 9, 2019
Sold by
Whiterock Avenue Llc
Bought by
Vaquera House Llc
Current Estimated Value
Home Financials for this Owner
Home Financials are based on the most recent Mortgage that was taken out on this home.
Original Mortgage
$1,725,500
Outstanding Balance
$1,517,021
Interest Rate
4.3%
Mortgage Type
Commercial
Estimated Equity
$1,951,968
Purchase Details
Closed on
Jun 18, 2004
Sold by
I L Y Trust
Bought by
Winkelmann Hermann Josef
Purchase Details
Closed on
Feb 27, 2004
Sold by
Dhiana
Bought by
I L Y Trust
Purchase Details
Closed on
Feb 10, 2004
Sold by
Clabaugh Diana Straw-
Bought by
I L Y Trust
Purchase Details
Closed on
Aug 7, 2001
Sold by
Clabaugh Nelson N
Bought by
Clabaugh Diana Straw-
Purchase Details
Closed on
Nov 21, 1994
Purchase Details
Closed on
Mar 18, 1993
Create a Home Valuation Report for This Property
The Home Valuation Report is an in-depth analysis detailing your home's value as well as a comparison with similar homes in the area
Home Values in the Area
Average Home Value in this Area
Purchase History
| Date | Buyer | Sale Price | Title Company |
|---|---|---|---|
| Vaquera House Llc | $2,337,500 | Land Title Guarantee Company | |
| Winkelmann Hermann Josef | $1,575,000 | -- | |
| I L Y Trust | -- | -- | |
| I L Y Trust | -- | -- | |
| Clabaugh Diana Straw- | -- | -- | |
| -- | $563,000 | -- | |
| -- | $24,500 | -- |
Source: Public Records
Mortgage History
| Date | Status | Borrower | Loan Amount |
|---|---|---|---|
| Open | Vaquera House Llc | $1,725,500 |
Source: Public Records
Tax History Compared to Growth
Tax History
| Year | Tax Paid | Tax Assessment Tax Assessment Total Assessment is a certain percentage of the fair market value that is determined by local assessors to be the total taxable value of land and additions on the property. | Land | Improvement |
|---|---|---|---|---|
| 2024 | $38,865 | $566,770 | $191,810 | $374,960 |
| 2023 | $43,767 | $558,400 | $191,810 | $366,590 |
| 2022 | $31,943 | $407,540 | $148,850 | $258,690 |
| 2021 | $18,382 | $266,440 | $148,850 | $117,590 |
| 2020 | $20,152 | $294,840 | $124,380 | $170,460 |
| 2019 | $31,162 | $465,310 | $124,380 | $340,930 |
| 2018 | $22,049 | $314,290 | $178,570 | $135,720 |
| 2017 | $21,931 | $314,290 | $178,570 | $135,720 |
| 2016 | $13,444 | $202,540 | $137,630 | $64,910 |
| 2015 | $20,208 | $202,540 | $137,630 | $64,910 |
| 2014 | $20,208 | $295,280 | $124,730 | $170,550 |
Source: Public Records
Map
Nearby Homes
- 602 & 604 Fourth St
- 418 Elk Ave
- 422 Belleview Ave
- 309 Belleview #2-C Residential Unit 2-C
- 309 Belleview #2-B Residential Unit 2-B
- 309 Belleview #2-A Residential Unit 2-A
- 308 Whiterock Ave
- 414 Maroon Ave
- 721 Whiterock Ave
- 513 Third St
- 315 Elk Ave
- 223 Sopris Ave
- 209 Whiterock Ave
- 398 Journey's End Rd
- 810 Elk Ave
- 721 Maroon Ave
- 218 Maroon Ave Unit E
- 609 2nd St
- 825 Whiterock Ave
- 413 2nd St
- 510 Whiterock Ave
- 502 Whiterock Ave
- 505 Belleview Unit 8
- 509 Belleview Unit 12
- 509 Belleview
- 503 Belleview Unit 3
- 505 Whiterock Ave
- 430 Whiterock Ave
- 507 Whiterock Ave
- 503 Whiterock Ave
- 426 Whiterock Ave
- 429 Whiterock Ave
- 512 1/2 Sopris Ave
- 0 Corner Bellevue Street Rd Unit 6220
- 425 Whiterock Ave
- 512, 512 1 Sopris Ave
- 423 Belleview Ave Unit 1
- 423 Belleview Ave Unit 1
- 423 Belleview Ave Unit 2
- 516 Sopris Ave