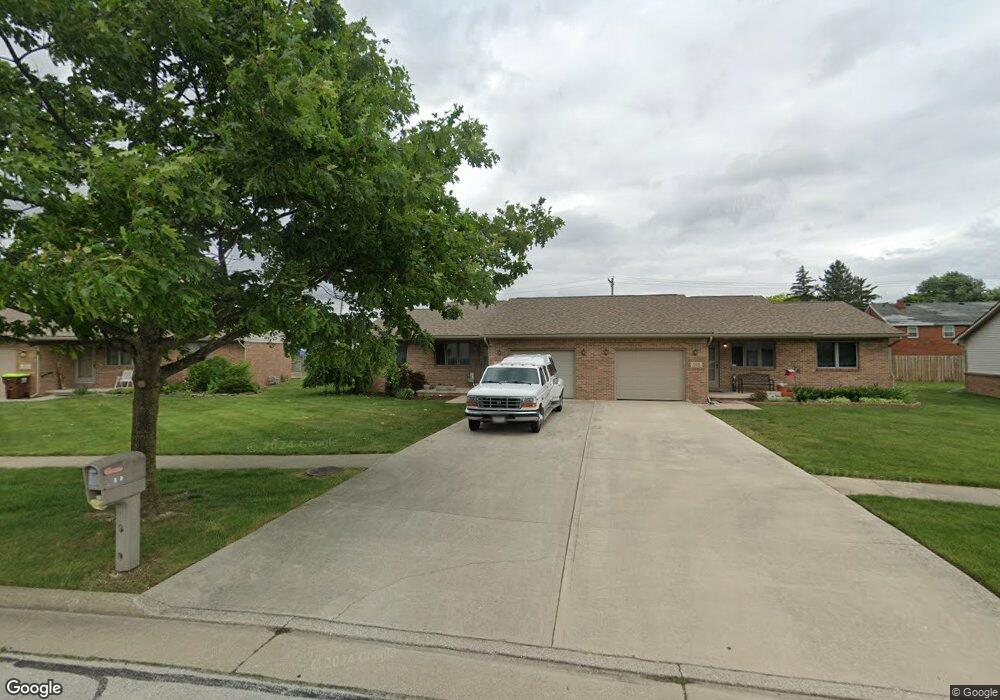
510 Woodpointe Dr Unit 510 Woodville, OH 43469
Estimated Value: $166,761 - $191,000
2
Beds
2
Baths
1,180
Sq Ft
$150/Sq Ft
Est. Value
About This Home
This home is located at 510 Woodpointe Dr Unit 510, Woodville, OH 43469 and is currently estimated at $176,690, approximately $149 per square foot. 510 Woodpointe Dr Unit 510 is a home located in Sandusky County with nearby schools including Woodmore Elementary School, Woodmore Middle School, and Solomon Lutheran School.
Ownership History
Date
Name
Owned For
Owner Type
Purchase Details
Closed on
Dec 19, 2006
Sold by
Ausmus Kathleen R
Bought by
Ws Series Iv Llc
Current Estimated Value
Purchase Details
Closed on
Nov 13, 2003
Sold by
Morrison Genevieve H
Bought by
Ausmus Kathleen R
Home Financials for this Owner
Home Financials are based on the most recent Mortgage that was taken out on this home.
Original Mortgage
$118,000
Interest Rate
5.81%
Mortgage Type
Purchase Money Mortgage
Purchase Details
Closed on
Mar 1, 2001
Sold by
Woodpointe Development L
Bought by
Morrison Genevieve H
Home Financials for this Owner
Home Financials are based on the most recent Mortgage that was taken out on this home.
Original Mortgage
$103,410
Interest Rate
7.06%
Mortgage Type
New Conventional
Create a Home Valuation Report for This Property
The Home Valuation Report is an in-depth analysis detailing your home's value as well as a comparison with similar homes in the area
Home Values in the Area
Average Home Value in this Area
Purchase History
| Date | Buyer | Sale Price | Title Company |
|---|---|---|---|
| Ws Series Iv Llc | -- | Chicago Title | |
| Ausmus Kathleen R | $88,500 | Midland Title | |
| Morrison Genevieve H | $114,900 | -- |
Source: Public Records
Mortgage History
| Date | Status | Borrower | Loan Amount |
|---|---|---|---|
| Previous Owner | Ausmus Kathleen R | $118,000 | |
| Previous Owner | Morrison Genevieve H | $103,410 |
Source: Public Records
Tax History Compared to Growth
Tax History
| Year | Tax Paid | Tax Assessment Tax Assessment Total Assessment is a certain percentage of the fair market value that is determined by local assessors to be the total taxable value of land and additions on the property. | Land | Improvement |
|---|---|---|---|---|
| 2024 | $2,459 | $47,740 | $7,140 | $40,600 |
| 2023 | $2,459 | $35,110 | $5,250 | $29,860 |
| 2022 | $2,095 | $35,110 | $5,250 | $29,860 |
| 2021 | $2,105 | $35,110 | $5,250 | $29,860 |
| 2020 | $2,154 | $34,340 | $5,250 | $29,090 |
| 2019 | $2,155 | $34,340 | $5,250 | $29,090 |
| 2018 | $2,155 | $34,340 | $5,250 | $29,090 |
| 2017 | $2,046 | $31,680 | $5,250 | $26,430 |
| 2016 | $1,984 | $31,680 | $5,250 | $26,430 |
| 2015 | $1,994 | $31,680 | $5,250 | $26,430 |
| 2014 | $2,321 | $35,110 | $8,470 | $26,640 |
| 2013 | $2,297 | $35,110 | $8,470 | $26,640 |
Source: Public Records
Map
Nearby Homes
- 571 Parklane Dr
- 421 Parklane Dr
- 739 Riverside Dr
- 612 W Main St
- 219 Lime St
- 212 S Perry St
- 415 Fort Findlay Rd
- 110 E 1st St
- 712 Lueke Ave Unit 572 p
- 20180 Us Highway 23
- 20240 W Portage River South Rd
- 0 Recker Rd
- 2067 Devils Hole Rd
- 0 Pemberville Rd
- 3291 Middleton Pike
- 1936 County Road 32
- 510 Wilson St
- 416 Castle Cove
- 514 West St
- 19383 Courtland Ave
- 508 Woodpointe Dr
- 514 Woodpointe Dr
- 506 Woodpointe Dr
- 504 Woodpointe Dr
- 516 Woodpointe Dr Unit 516
- 517 Woodpointe Dr Unit 517
- 518 Woodpointe Dr
- 515 Woodpointe Dr
- 523 Woodpointe Dr Unit 523
- 1116 W College Ave
- 520 Woodpointe Dr
- 1101 Erie Ct
- 525 Woodpointe Dr
- 1103 Erie Ct Unit 1103
- 522 Woodpointe Dr
- 1026 W Erie St
- 527 Woodpointe Dr
- 405 Woodpointe Dr
- 1105 Erie Ct