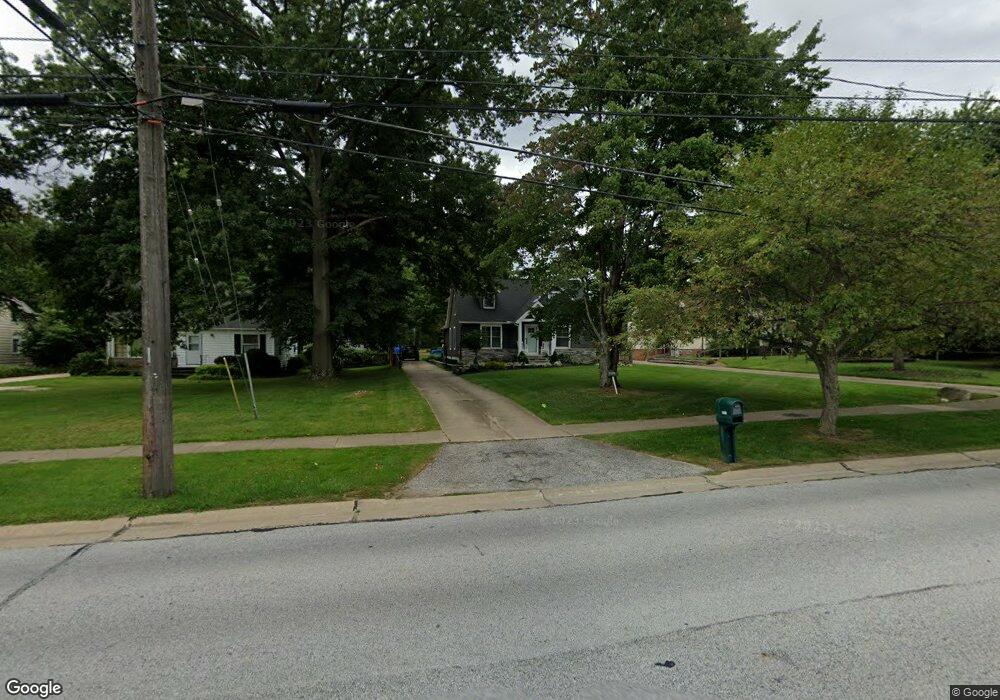
5100 Chestnut Rd Independence, OH 44131
Estimated Value: $293,608 - $343,000
4
Beds
3
Baths
2,076
Sq Ft
$156/Sq Ft
Est. Value
About This Home
This home is located at 5100 Chestnut Rd, Independence, OH 44131 and is currently estimated at $324,652, approximately $156 per square foot. 5100 Chestnut Rd is a home located in Cuyahoga County with nearby schools including Independence Primary School, Independence Middle School, and Independence High School.
Ownership History
Date
Name
Owned For
Owner Type
Purchase Details
Closed on
Sep 7, 2017
Sold by
Lontor George
Bought by
Dulik Daniel P and Dulik Valerie R
Current Estimated Value
Home Financials for this Owner
Home Financials are based on the most recent Mortgage that was taken out on this home.
Original Mortgage
$147,000
Outstanding Balance
$122,821
Interest Rate
3.92%
Mortgage Type
Purchase Money Mortgage
Estimated Equity
$201,831
Purchase Details
Closed on
Mar 5, 2012
Sold by
Grencewicz Timothy and Grencewicz Mary Kathryn
Bought by
Lontor Karen and Lontor George
Purchase Details
Closed on
Mar 3, 2012
Sold by
Grencewicz Jerome and Grencewicz Sharon
Bought by
Lontor Karen and Lontor George
Purchase Details
Closed on
Aug 13, 2004
Sold by
Grencewicz Peter and Grencewicz Mildred
Bought by
Lontor Karen and Grencewicz Jerome
Purchase Details
Closed on
Mar 30, 1985
Sold by
Grencewicz Mildred
Bought by
Peter Grencewicz
Purchase Details
Closed on
Jan 1, 1975
Bought by
Grencewicz Mildred
Create a Home Valuation Report for This Property
The Home Valuation Report is an in-depth analysis detailing your home's value as well as a comparison with similar homes in the area
Home Values in the Area
Average Home Value in this Area
Purchase History
| Date | Buyer | Sale Price | Title Company |
|---|---|---|---|
| Dulik Daniel P | $166,000 | City Title Co | |
| Lontor Karen | $33,000 | None Available | |
| Lontor Karen | $33,000 | Attorney | |
| Lontor Karen | -- | Public | |
| Peter Grencewicz | -- | -- | |
| Grencewicz Mildred | -- | -- |
Source: Public Records
Mortgage History
| Date | Status | Borrower | Loan Amount |
|---|---|---|---|
| Open | Dulik Daniel P | $147,000 |
Source: Public Records
Tax History
| Year | Tax Paid | Tax Assessment Tax Assessment Total Assessment is a certain percentage of the fair market value that is determined by local assessors to be the total taxable value of land and additions on the property. | Land | Improvement |
|---|---|---|---|---|
| 2024 | $4,258 | $89,040 | $16,940 | $72,100 |
| 2023 | $3,324 | $63,150 | $16,070 | $47,080 |
| 2022 | $3,305 | $63,140 | $16,070 | $47,080 |
| 2021 | $3,257 | $63,140 | $16,070 | $47,080 |
| 2020 | $3,004 | $54,640 | $14,740 | $39,900 |
| 2019 | $2,900 | $156,100 | $42,100 | $114,000 |
| 2018 | $2,905 | $54,250 | $14,740 | $39,520 |
| 2017 | $2,653 | $46,560 | $12,150 | $34,410 |
| 2016 | $2,626 | $46,560 | $12,150 | $34,410 |
| 2015 | $2,624 | $46,560 | $12,150 | $34,410 |
| 2014 | $2,624 | $46,560 | $12,150 | $34,410 |
Source: Public Records
Map
Nearby Homes
- 0 Daisy Blvd
- 0 Acorn Dr Unit 5023848
- 0 Brecksville Rd
- 6990 S Great Oaks Pkwy
- 6473 Tanglewood Ln
- VL Laura Lee Ln
- VL TBB Laura Lee Ln
- 1026 Joy Oval
- 6258 Carlyle Dr
- 8420 Stone Rd
- 7477 Ludwin Dr
- 5024 Dorset Dr
- 423 E Decker Dr
- 6312 E Pleasant Valley Rd
- 5770 N Crossview Rd
- 5981 Northview Dr
- 7311 Brecksville Rd
- 7003 Brecksville Rd
- 100 E Decker Dr
- 872 E Dawnwood Dr
- 5016 Chestnut Rd
- 5108 Chestnut Rd
- 5112 Chestnut Rd
- 5006 Chestnut Rd
- 5200 Chestnut Rd
- 6508 Willow Dr
- 5109 Great Oaks Pkwy
- 5017 Great Oaks Pkwy
- 4912 Chestnut Rd
- 5007 Great Oaks Pkwy
- 6503 Willow Dr
- 5113 Great Oaks Pkwy
- 5210 Chestnut Rd
- 6497 Poplar Dr
- 6504 Willow Dr
- 5015 Chestnut Rd
- 4880 Chestnut Rd
- 4851 Great Oaks Pkwy
- 5207 Chestnut Rd
- 6495 Poplar Dr
Your Personal Tour Guide
Ask me questions while you tour the home.