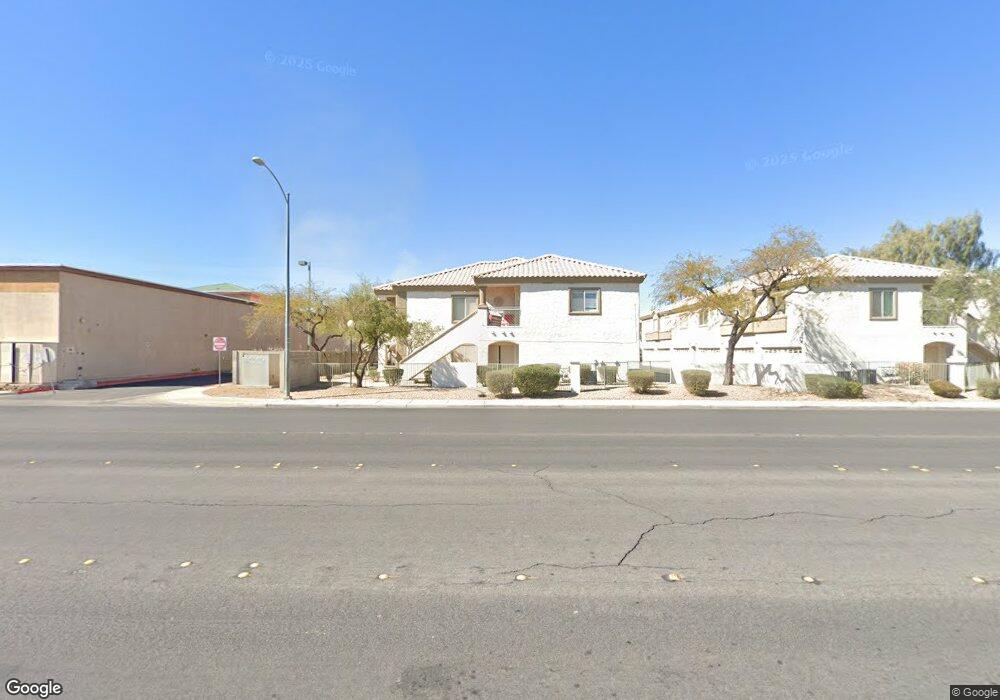
5100 Jordan Frey St Unit 204 Las Vegas, NV 89130
Estimated Value: $268,915 - $285,000
3
Beds
2
Baths
1,259
Sq Ft
$221/Sq Ft
Est. Value
About This Home
This home is located at 5100 Jordan Frey St Unit 204, Las Vegas, NV 89130 and is currently estimated at $278,479, approximately $221 per square foot. 5100 Jordan Frey St Unit 204 is a home located in Clark County with nearby schools including Ernest May Elementary School, Theron L Swainston Middle School, and Shadow Ridge High School.
Ownership History
Date
Name
Owned For
Owner Type
Purchase Details
Closed on
Aug 29, 2001
Sold by
Nunez Gloria
Bought by
Rodriguez Alfredo
Current Estimated Value
Home Financials for this Owner
Home Financials are based on the most recent Mortgage that was taken out on this home.
Original Mortgage
$97,650
Outstanding Balance
$38,245
Interest Rate
7.05%
Mortgage Type
FHA
Estimated Equity
$240,234
Purchase Details
Closed on
Aug 5, 1999
Sold by
Nunez Gloria A
Bought by
Rodriguez Alfredo
Home Financials for this Owner
Home Financials are based on the most recent Mortgage that was taken out on this home.
Original Mortgage
$75,600
Interest Rate
9.62%
Purchase Details
Closed on
Nov 20, 1995
Sold by
Pueblo L L C
Bought by
Yanez Sonia and Perez Luz M
Home Financials for this Owner
Home Financials are based on the most recent Mortgage that was taken out on this home.
Original Mortgage
$71,900
Interest Rate
7.42%
Create a Home Valuation Report for This Property
The Home Valuation Report is an in-depth analysis detailing your home's value as well as a comparison with similar homes in the area
Home Values in the Area
Average Home Value in this Area
Purchase History
| Date | Buyer | Sale Price | Title Company |
|---|---|---|---|
| Rodriguez Alfredo | -- | Stewart Title | |
| Rodriguez Alfredo | -- | Old Republic Title Company | |
| Rodriguez Alfredo | $94,500 | Old Republic Title Company | |
| Yanez Sonia | $91,000 | Nevada Title Company |
Source: Public Records
Mortgage History
| Date | Status | Borrower | Loan Amount |
|---|---|---|---|
| Open | Rodriguez Alfredo | $97,650 | |
| Closed | Rodriguez Alfredo | $75,600 | |
| Previous Owner | Yanez Sonia | $71,900 | |
| Closed | Rodriguez Alfredo | $18,900 |
Source: Public Records
Tax History Compared to Growth
Tax History
| Year | Tax Paid | Tax Assessment Tax Assessment Total Assessment is a certain percentage of the fair market value that is determined by local assessors to be the total taxable value of land and additions on the property. | Land | Improvement |
|---|---|---|---|---|
| 2025 | $1,064 | $58,735 | $21,700 | $37,035 |
| 2024 | $986 | $58,735 | $21,700 | $37,035 |
| 2023 | $986 | $60,178 | $25,900 | $34,278 |
| 2022 | $913 | $50,342 | $18,550 | $31,792 |
| 2021 | $846 | $48,561 | $17,850 | $30,711 |
| 2020 | $782 | $46,982 | $16,800 | $30,182 |
| 2019 | $733 | $45,092 | $15,050 | $30,042 |
| 2018 | $700 | $38,084 | $8,750 | $29,334 |
| 2017 | $1,214 | $37,025 | $7,000 | $30,025 |
| 2016 | $656 | $27,722 | $5,250 | $22,472 |
| 2015 | $654 | $21,987 | $3,850 | $18,137 |
| 2014 | $635 | $18,781 | $5,250 | $13,531 |
Source: Public Records
Map
Nearby Homes
- 6704 Indian Chief Dr Unit 101
- 6701 Squaw Mountain Dr Unit 201
- 6705 Squaw Mountain Dr Unit 102
- 6901 Squaw Mountain Dr Unit 202
- 5112 Harvest Time St Unit 201
- 6825 Rio Sands Ct
- 5213 Standing Rock Place
- 28460 U S Route 95
- 5300 White Coyote Place
- 6458 White Tiger Ct
- 6507 Dove Point Place
- 5060 Serene Skies St
- 5409 Flora Spray St
- 5059 Tranquil View St
- 5039 Tranquil View St
- 6613 Sand Bench Ave
- 5148 Forest Oaks Dr
- 5041 Portraits Place
- 5152 Forest Oaks Dr
- 5424 Goldbrush St
- 5100 Jordan Frey St Unit 202
- 5100 Jordan Frey St Unit 201
- 5100 Jordan Frey St Unit 101
- 5100 Jordan Frey St Unit 102
- 5104 Jordan Frey St
- 5104 Jordan Frey St Unit 202
- 5104 Jordan Frey St Unit 201
- 5104 Jordan Frey St Unit 204
- 5104 Jordan Frey St Unit 203
- 5104 Jordan Frey St Unit 101
- 6700 Indian Chief Dr Unit 203
- 6700 Indian Chief Dr Unit 201
- 6700 Indian Chief Dr Unit 204
- 6700 Indian Chief Dr Unit 202
- 6700 Indian Chief Dr Unit 102
- 6700 Indian Chief Dr Unit 101
- 5112 Jordan Frey St Unit 201
- 5112 Jordan Frey St Unit 202
- 5112 Jordan Frey St Unit 203
- 5112 Jordan Frey St Unit 204