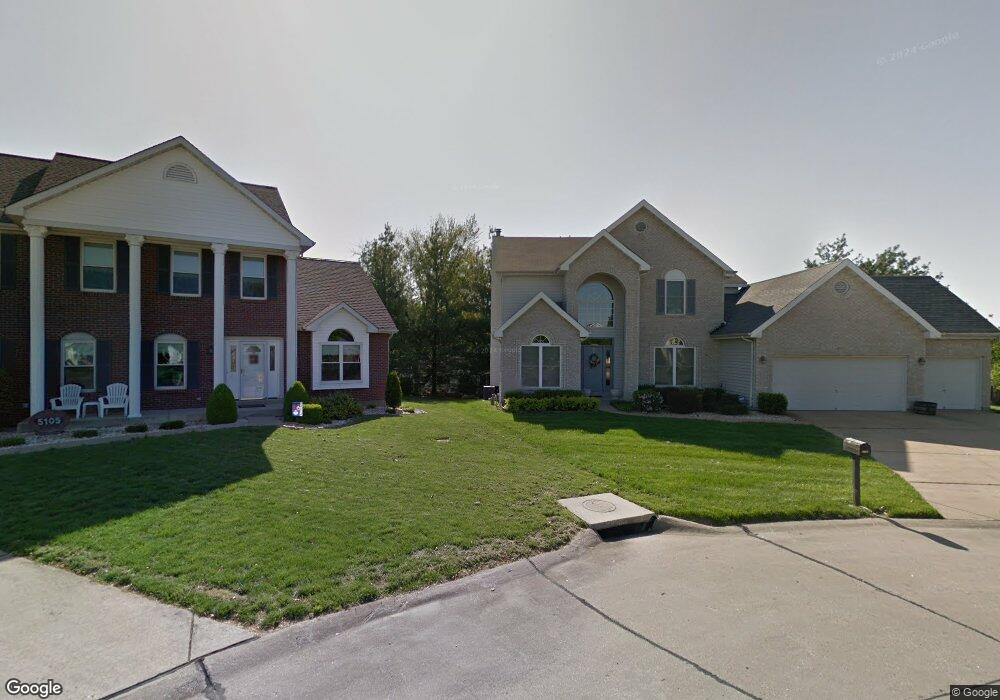
5100 Kennerly Pines Ct Saint Louis, MO 63128
Estimated Value: $486,000 - $617,000
4
Beds
3
Baths
2,538
Sq Ft
$226/Sq Ft
Est. Value
About This Home
This home is located at 5100 Kennerly Pines Ct, Saint Louis, MO 63128 and is currently estimated at $574,800, approximately $226 per square foot. 5100 Kennerly Pines Ct is a home located in St. Louis County with nearby schools including Kennerly Elementary School, Sperreng Middle School, and Lindbergh High School.
Ownership History
Date
Name
Owned For
Owner Type
Purchase Details
Closed on
Dec 27, 2020
Sold by
Pelattini Amir H and Pelattini Lori A
Bought by
Pelattini Amir H and Pelattini Lori A
Current Estimated Value
Purchase Details
Closed on
Sep 23, 2002
Sold by
Cho Iue C and Cho Barbara A
Bought by
Pelattini Amir H and Pelattini Lori A
Home Financials for this Owner
Home Financials are based on the most recent Mortgage that was taken out on this home.
Original Mortgage
$160,000
Outstanding Balance
$66,642
Interest Rate
6.2%
Estimated Equity
$508,158
Purchase Details
Closed on
Feb 27, 1997
Sold by
Remmington Homes Ltd
Bought by
Cho Ive C and Cho Barbara A
Home Financials for this Owner
Home Financials are based on the most recent Mortgage that was taken out on this home.
Original Mortgage
$207,550
Interest Rate
5.75%
Create a Home Valuation Report for This Property
The Home Valuation Report is an in-depth analysis detailing your home's value as well as a comparison with similar homes in the area
Home Values in the Area
Average Home Value in this Area
Purchase History
| Date | Buyer | Sale Price | Title Company |
|---|---|---|---|
| Pelattini Amir H | -- | None Available | |
| Pelattini Amir H | $360,000 | -- | |
| Cho Ive C | -- | -- |
Source: Public Records
Mortgage History
| Date | Status | Borrower | Loan Amount |
|---|---|---|---|
| Open | Pelattini Amir H | $160,000 | |
| Previous Owner | Cho Ive C | $207,550 |
Source: Public Records
Tax History Compared to Growth
Tax History
| Year | Tax Paid | Tax Assessment Tax Assessment Total Assessment is a certain percentage of the fair market value that is determined by local assessors to be the total taxable value of land and additions on the property. | Land | Improvement |
|---|---|---|---|---|
| 2025 | $5,988 | $93,650 | $16,020 | $77,630 |
| 2024 | $5,988 | $92,270 | $16,020 | $76,250 |
| 2023 | $5,973 | $92,270 | $16,020 | $76,250 |
| 2022 | $5,019 | $74,350 | $16,020 | $58,330 |
| 2021 | $4,841 | $74,350 | $16,020 | $58,330 |
| 2020 | $5,105 | $75,680 | $16,020 | $59,660 |
| 2019 | $5,092 | $75,680 | $16,020 | $59,660 |
| 2018 | $5,236 | $70,800 | $9,790 | $61,010 |
| 2017 | $5,179 | $70,800 | $9,790 | $61,010 |
| 2016 | $4,781 | $62,040 | $9,790 | $52,250 |
| 2015 | $4,708 | $62,040 | $9,790 | $52,250 |
| 2014 | $4,332 | $56,500 | $15,500 | $41,000 |
Source: Public Records
Map
Nearby Homes
- 4801 Langtree Dr
- 5100 Melitta Dr
- 5135 Towne Centre Dr
- 4645 Tauneybrook Dr
- 4839 Hursley Dr
- 4833 Hursley Dr
- 4942 Caribee Dr
- 10016 Schuessler Rd
- 4643 Littlebury Dr
- 5057 Peyton Place Ct
- 4818 Chapel Hill Dr
- 10124 Carolynne Dr
- 10033 Carolynne Dr
- 4915 Butler Hill Rd
- 4947 Butler Hill Rd
- 12055 Charwick Dr
- 10026 Canterbury Farms Ct
- 4449 Pinyon Jay Ct
- 10315 Kennerly Rd
- 12015 Charwick Dr
- 5106 Kennerly Pines Ct
- 4777 Langtree Dr
- 5105 Kennerly Pines Ct
- 4807 Langtree Dr
- 4771 Langtree Dr
- 5112 Kennerly Pines Ct
- 5111 Kennerly Pines Ct
- 4815 Langtree Dr
- 4765 Langtree Dr
- 5101 Kennerly Place Dr Unit 8
- 5102 Starboard Side Dr Unit 9
- 5118 Kennerly Pines Ct
- 5117 Kennerly Pines Ct
- 5060 Sherborne Dr
- 5055 Sherborne Dr
- 5125 Kennerly Place Dr
- 5117 Kennerly Place Dr
- 4821 Langtree Dr
- 4759 Langtree Dr
- 4768 Langtree Dr