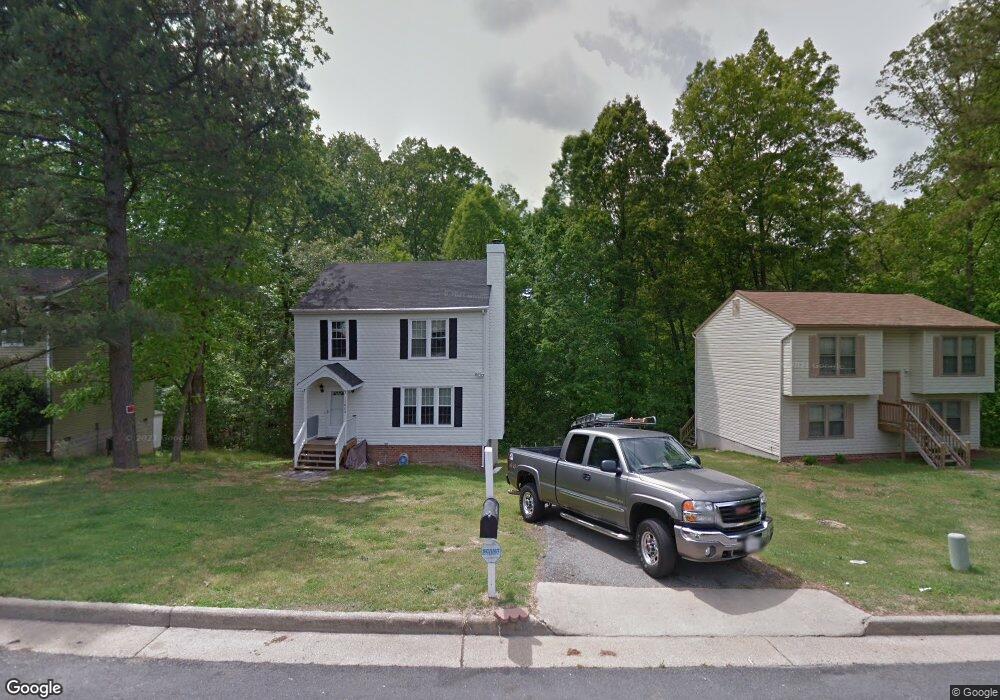
5100 S Jessup Rd Chesterfield, VA 23832
Estimated Value: $300,000 - $312,000
3
Beds
2
Baths
1,456
Sq Ft
$211/Sq Ft
Est. Value
About This Home
This home is located at 5100 S Jessup Rd, Chesterfield, VA 23832 and is currently estimated at $306,916, approximately $210 per square foot. 5100 S Jessup Rd is a home located in Chesterfield County with nearby schools including J G Hening Elementary School, Manchester Middle School, and Meadowbrook High School.
Ownership History
Date
Name
Owned For
Owner Type
Purchase Details
Closed on
Jun 1, 2023
Sold by
Samuel I White Pc
Bought by
Fox James M and Burrows Barbara B
Current Estimated Value
Purchase Details
Closed on
Mar 6, 2000
Bought by
Fox James M and Burrows Barbara B
Home Financials for this Owner
Home Financials are based on the most recent Mortgage that was taken out on this home.
Original Mortgage
$75,850
Interest Rate
8.21%
Mortgage Type
FHA
Purchase Details
Closed on
Nov 17, 1997
Sold by
Gordon Jacqueline D
Bought by
Gordon Troy W and Gordon Jacqueline D
Home Financials for this Owner
Home Financials are based on the most recent Mortgage that was taken out on this home.
Original Mortgage
$27,717
Interest Rate
7.23%
Mortgage Type
New Conventional
Create a Home Valuation Report for This Property
The Home Valuation Report is an in-depth analysis detailing your home's value as well as a comparison with similar homes in the area
Home Values in the Area
Average Home Value in this Area
Purchase History
| Date | Buyer | Sale Price | Title Company |
|---|---|---|---|
| Fox James M | $203,847 | None Listed On Document | |
| Fox James M | -- | -- | |
| Gordon Troy W | -- | -- |
Source: Public Records
Mortgage History
| Date | Status | Borrower | Loan Amount |
|---|---|---|---|
| Previous Owner | Gordon Troy W | $75,850 | |
| Previous Owner | Gordon Troy W | $27,717 |
Source: Public Records
Tax History Compared to Growth
Tax History
| Year | Tax Paid | Tax Assessment Tax Assessment Total Assessment is a certain percentage of the fair market value that is determined by local assessors to be the total taxable value of land and additions on the property. | Land | Improvement |
|---|---|---|---|---|
| 2025 | $2,574 | $286,400 | $55,000 | $231,400 |
| 2024 | $2,574 | $270,600 | $50,000 | $220,600 |
| 2023 | $2,242 | $246,400 | $47,000 | $199,400 |
| 2022 | $2,131 | $231,600 | $45,000 | $186,600 |
| 2021 | $1,911 | $198,500 | $43,000 | $155,500 |
| 2020 | $1,787 | $188,100 | $41,000 | $147,100 |
| 2019 | $1,663 | $175,100 | $39,000 | $136,100 |
| 2018 | $1,552 | $163,400 | $35,000 | $128,400 |
| 2017 | $1,487 | $154,900 | $35,000 | $119,900 |
| 2016 | $1,434 | $149,400 | $34,000 | $115,400 |
| 2015 | $1,368 | $142,500 | $34,000 | $108,500 |
| 2014 | $648 | $134,900 | $34,000 | $100,900 |
Source: Public Records
Map
Nearby Homes
- 5206 Hallmark Dr
- 5125 Hackney Rd
- 4811 Hackney Rd
- 7141 Barkbridge Rd
- 4407 Ketcham Dr
- 7020 Summers Trace Ct
- 5819 Kings Grove Dr
- 4367 Collingswood Dr
- 7342 Drexelbrook Rd
- 4307 Ketcham Dr
- 4344 Collingswood Dr
- 5884 Heathers Crossing Dr
- 4003 Laughton Ct
- 6900 Summers Trace Terrace
- 6912 Laughton Dr
- 3901 Old Creek Rd
- 3429 Jessup Pond Ln
- 3405 Jessup Pond Ln
- 3409 Jessup Pond Ln
- 3417 Jessup Pond Ln
- 6624 Jessup Rd
- 5108 S Jessup Rd
- 5103 Berryridge Terrace
- 5101 Berryridge Terrace
- 5100 Hallmark Dr
- 6625 Jessup Rd
- 5112 S Jessup Rd
- 6619 Jessup Rd
- 5113 S Jessup Rd
- 5105 Berryridge Terrace
- 5106 Hallmark Dr
- 5118 S Jessup Rd
- 6613 Jessup Rd
- 5102 Berryridge Terrace
- 5119 S Jessup Rd
- 5111 Berryridge Terrace
- 5124 S Jessup Rd
- 5104 Berryridge Terrace
- 5004 Hallmark Ct
- 6607 Jessup Rd