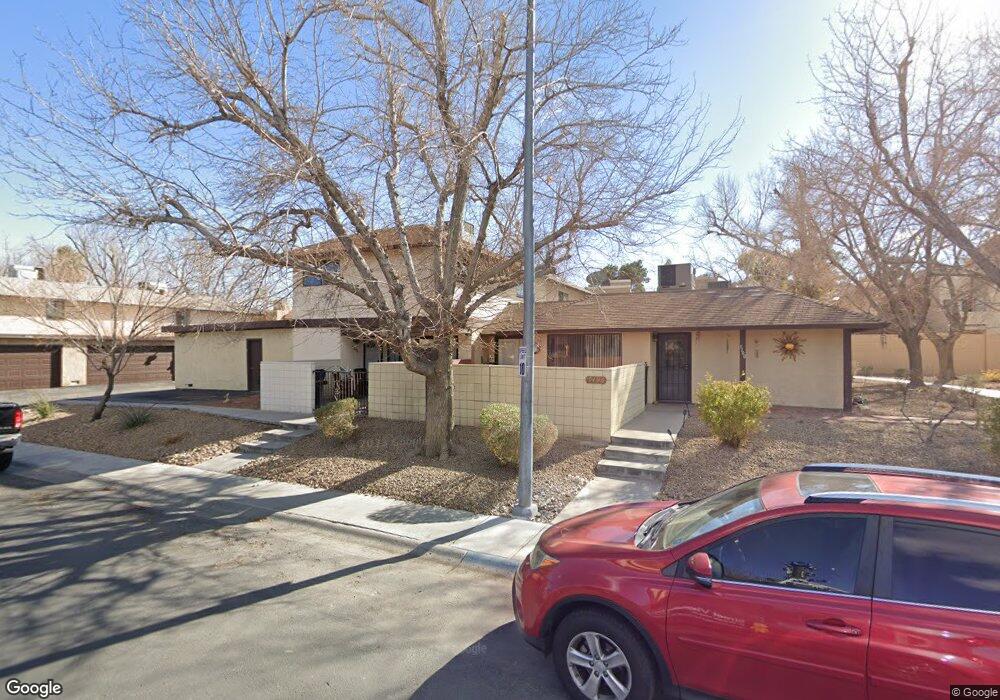
5100 Village Dr Las Vegas, NV 89142
Estimated Value: $236,000 - $241,000
2
Beds
1
Bath
903
Sq Ft
$264/Sq Ft
Est. Value
About This Home
This home is located at 5100 Village Dr, Las Vegas, NV 89142 and is currently estimated at $238,366, approximately $263 per square foot. 5100 Village Dr is a home located in Clark County with nearby schools including Cyril Wengert Elementary School, Duane D. Keller Middle School, and Las Vegas High School.
Ownership History
Date
Name
Owned For
Owner Type
Purchase Details
Closed on
Jan 8, 2014
Sold by
Carolyn Cintron Trust
Bought by
Cintron Jennifer A
Current Estimated Value
Purchase Details
Closed on
Apr 6, 2005
Sold by
Cintron Carolyn
Bought by
Carolyn Cintron Trust
Purchase Details
Closed on
Apr 1, 1999
Sold by
Omalls William M
Bought by
Cintron Carolyn
Home Financials for this Owner
Home Financials are based on the most recent Mortgage that was taken out on this home.
Original Mortgage
$59,000
Interest Rate
6.98%
Purchase Details
Closed on
May 14, 1996
Sold by
Nevada State Bank
Bought by
Omalia William M
Home Financials for this Owner
Home Financials are based on the most recent Mortgage that was taken out on this home.
Original Mortgage
$49,833
Interest Rate
7.97%
Mortgage Type
FHA
Create a Home Valuation Report for This Property
The Home Valuation Report is an in-depth analysis detailing your home's value as well as a comparison with similar homes in the area
Home Values in the Area
Average Home Value in this Area
Purchase History
| Date | Buyer | Sale Price | Title Company |
|---|---|---|---|
| Cintron Jennifer A | -- | None Available | |
| Carolyn Cintron Trust | -- | -- | |
| Cintron Carolyn | $64,000 | Fidelity National Title Agen | |
| Omalia William M | $50,000 | United Title |
Source: Public Records
Mortgage History
| Date | Status | Borrower | Loan Amount |
|---|---|---|---|
| Previous Owner | Cintron Carolyn | $59,000 | |
| Previous Owner | Omalia William M | $49,833 |
Source: Public Records
Tax History Compared to Growth
Tax History
| Year | Tax Paid | Tax Assessment Tax Assessment Total Assessment is a certain percentage of the fair market value that is determined by local assessors to be the total taxable value of land and additions on the property. | Land | Improvement |
|---|---|---|---|---|
| 2025 | $548 | $30,549 | $17,850 | $12,699 |
| 2024 | $534 | $30,549 | $17,850 | $12,699 |
| 2023 | $534 | $31,354 | $20,300 | $11,054 |
| 2022 | $519 | $27,366 | $16,450 | $10,916 |
| 2021 | $361 | $23,282 | $14,000 | $9,282 |
| 2020 | $347 | $21,963 | $11,900 | $10,063 |
| 2019 | $343 | $20,060 | $9,800 | $10,260 |
| 2018 | $327 | $18,129 | $8,050 | $10,079 |
| 2017 | $518 | $17,673 | $7,350 | $10,323 |
| 2016 | $308 | $16,203 | $5,950 | $10,253 |
| 2015 | $306 | $14,076 | $4,550 | $9,526 |
| 2014 | $296 | $11,566 | $3,500 | $8,066 |
Source: Public Records
Map
Nearby Homes
- 5083 Village Dr
- 5115 Blossom Ave
- 1889 Cane Hill Dr
- 5209 Champions Ave
- 1836 Winterwood Blvd
- 2450 Tournament St
- 4825 Patterson Ave
- 5245 Sandstone Dr
- 5310 Sandstone Dr
- 2454 Winterwood Blvd
- 1919 Niblick Cir
- 0 E Sahara Ave Unit 2582056
- 5406 Silverheart Ave
- 4890 Idaho Ave
- 2484 Anglia St
- 4773 Welter Ave
- 4785 E Cincinnati Ave
- 1405 S Nellis Blvd Unit 2082
- 1405 S Nellis Blvd Unit 1121
- 1405 S Nellis Blvd Unit 2015
- 5098 Village Dr
- 5102 Village Dr
- 5104 Village Dr
- 5087 Village Dr
- 5087 Village Dr
- 5089 Village Dr
- 5090 Village Dr
- 5099 Village Dr
- 5092 Village Dr
- 5092 Village Dr Unit 72
- 5105 Village Dr
- 5091 Village Dr
- 5093 Village Dr
- 5096 Village Dr
- 5096 Village Dr Unit 70
- 5094 Village Dr
- 5094 Village Dr Unit 69
- 5097 Village Dr
- 5103 Village Dr Unit 54
- 5103 Village Dr