Estimated Value: $171,000 - $236,000
2
Beds
1
Bath
1,200
Sq Ft
$172/Sq Ft
Est. Value
About This Home
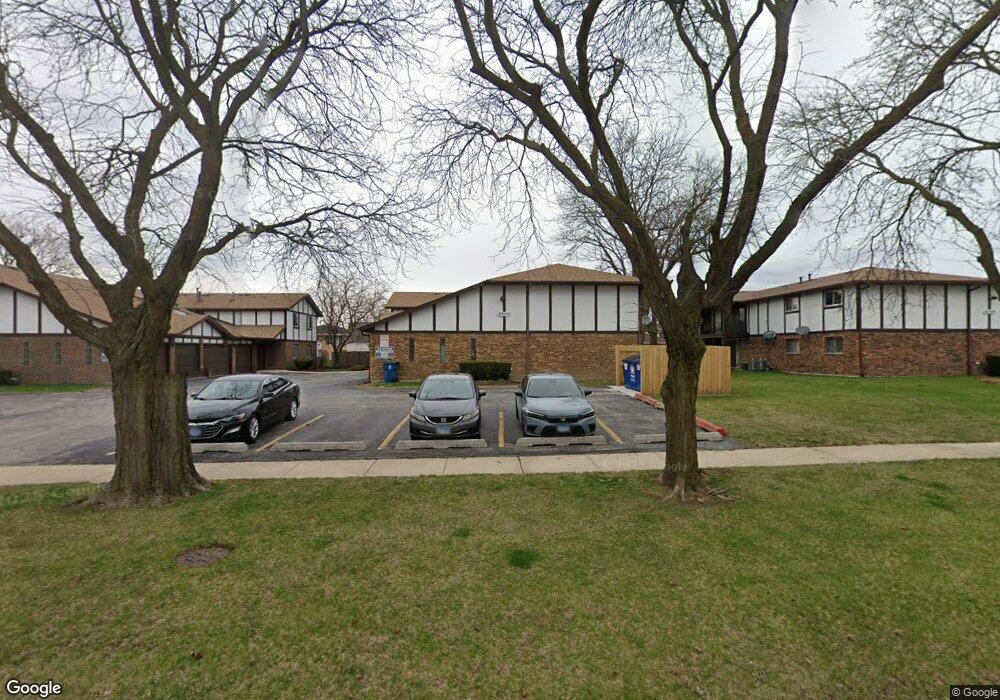
This home is located at 5100 W 122nd St Unit 2A5100, Alsip, IL 60803 and is currently estimated at $206,234, approximately $171 per square foot. 5100 W 122nd St Unit 2A5100 is a home located in Cook County with nearby schools including Hazelgreen Elementary School, Prairie Jr High School, and A B Shepard High School.
Ownership History
Date
Name
Owned For
Owner Type
Purchase Details
Closed on
Oct 18, 2017
Sold by
Brock Anita Denice
Bought by
Brock Anita D and Anita D Brock Trust
Current Estimated Value
Purchase Details
Closed on
Sep 17, 2012
Sold by
Vinicky Ronald
Bought by
Brock Anita Denice
Home Financials for this Owner
Home Financials are based on the most recent Mortgage that was taken out on this home.
Original Mortgage
$67,200
Outstanding Balance
$46,522
Interest Rate
3.58%
Mortgage Type
New Conventional
Estimated Equity
$159,712
Purchase Details
Closed on
Aug 16, 2004
Sold by
Vinicky Ronald J
Bought by
Vinicky Ronald R
Home Financials for this Owner
Home Financials are based on the most recent Mortgage that was taken out on this home.
Original Mortgage
$96,900
Interest Rate
6.5%
Mortgage Type
Unknown
Create a Home Valuation Report for This Property
The Home Valuation Report is an in-depth analysis detailing your home's value as well as a comparison with similar homes in the area
Home Values in the Area
Average Home Value in this Area
Purchase History
| Date | Buyer | Sale Price | Title Company |
|---|---|---|---|
| Brock Anita D | -- | None Available | |
| Brock Anita Denice | $84,000 | Fidelity National Title | |
| Vinicky Ronald R | $102,000 | Atgf Inc |
Source: Public Records
Mortgage History
| Date | Status | Borrower | Loan Amount |
|---|---|---|---|
| Open | Brock Anita Denice | $67,200 | |
| Previous Owner | Vinicky Ronald R | $96,900 |
Source: Public Records
Tax History Compared to Growth
Tax History
| Year | Tax Paid | Tax Assessment Tax Assessment Total Assessment is a certain percentage of the fair market value that is determined by local assessors to be the total taxable value of land and additions on the property. | Land | Improvement |
|---|---|---|---|---|
| 2024 | $3,708 | $14,508 | $2,116 | $12,392 |
| 2023 | $1,500 | $14,508 | $2,116 | $12,392 |
| 2022 | $1,500 | $7,157 | $2,419 | $4,738 |
| 2021 | $1,461 | $7,155 | $2,418 | $4,737 |
| 2020 | $1,530 | $7,155 | $2,418 | $4,737 |
| 2019 | $1,536 | $7,349 | $2,191 | $5,158 |
| 2018 | $1,476 | $7,349 | $2,191 | $5,158 |
| 2017 | $1,509 | $7,349 | $2,191 | $5,158 |
| 2016 | $2,210 | $8,197 | $1,813 | $6,384 |
| 2015 | $2,144 | $8,197 | $1,813 | $6,384 |
| 2014 | $1,895 | $7,187 | $1,813 | $5,374 |
| 2013 | $2,362 | $9,509 | $1,813 | $7,696 |
Source: Public Records
Map
Nearby Homes
- 5008 W 122nd St Unit 1A
- 4818 W 122nd St Unit 3W
- 11903 S Laramie Ave
- 12147 S Cicero Ave
- 4735 W 122nd St
- 11906 S Cicero Ave
- 5544 W Cal Sag Rd
- 11600 S Lamon Ave
- 12620 S Alpine Dr Unit 4
- 12613 S Parkside Ave
- 12642 S Central Ave
- 12649 S Parkside Ave
- 11553 S Joalyce Dr
- 12026 S Kildare Ave Unit 16
- 5844 W 124th St
- 12721 Park Place Unit 2B
- 5356 W Dixie Dr Unit 5356
- 5520 W 115th St Unit 101
- 5715 Park Place Unit J2
- 5715 Park Place Unit K1
- 5100 W 122nd St Unit 1B
- 5100 W 122nd St Unit 1A5100
- 5100 W 122nd St Unit 1B5100
- 5100 W 122nd St Unit 2B5100
- 5100 W 122nd St Unit 2A
- 5100 W 122nd St Unit 1A
- 5000 W 122nd St Unit 2A
- 5000 W 122nd St Unit 1A5000
- 5000 W 122nd St Unit 1B5000
- 5000 W 122nd St Unit 2A5000
- 5000 W 122nd St Unit 2B5000
- 5000 W 122nd St Unit 1B
- 5000 W 122nd St Unit 1A
- 5048 W 122nd St Unit 1B
- 5048 W 122nd St Unit 2A5048
- 5048 W 122nd St Unit 2B5048
- 5048 W 122nd St Unit 1B5048
- 5048 W 122nd St Unit 1A5048
- 5048 W 122nd St Unit 2B
- 5108 W 122nd St Unit 1A5108