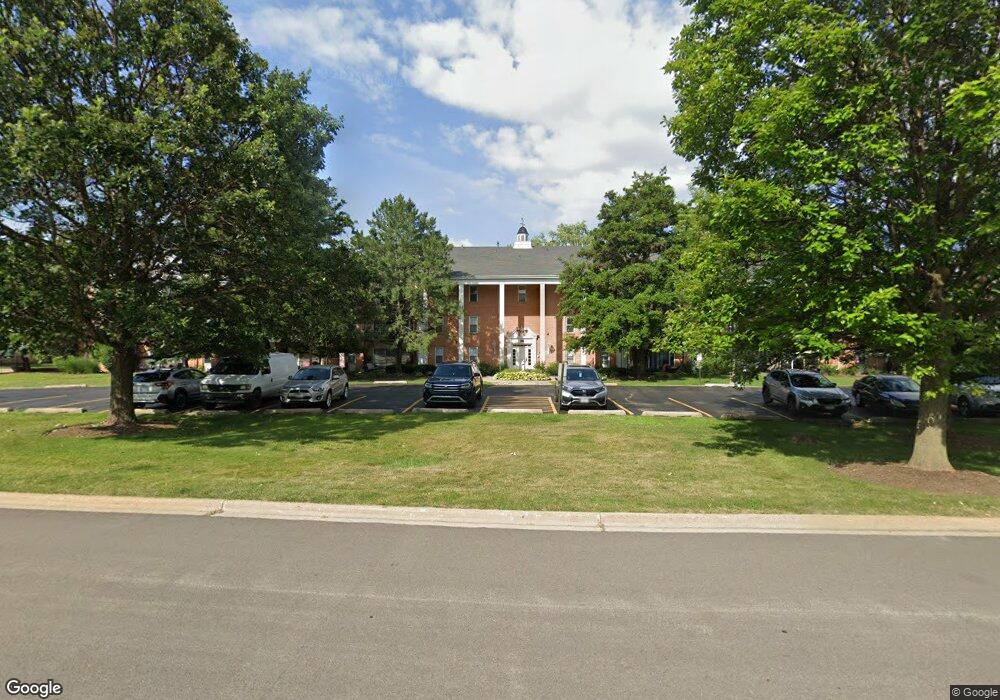
5101 Carriageway Dr Unit B21 Rolling Meadows, IL 60008
Busse Woods NeighborhoodEstimated Value: $146,000 - $189,000
2
Beds
1
Bath
1,000
Sq Ft
$177/Sq Ft
Est. Value
About This Home
This home is located at 5101 Carriageway Dr Unit B21, Rolling Meadows, IL 60008 and is currently estimated at $176,872, approximately $176 per square foot. 5101 Carriageway Dr Unit B21 is a home located in Cook County with nearby schools including Willow Bend Elementary School, Carl Sandburg Junior High School, and Rolling Meadows High School.
Ownership History
Date
Name
Owned For
Owner Type
Purchase Details
Closed on
Jul 15, 2025
Sold by
Niemiec Anna and Niemiec Jan
Bought by
Niemiec Anna and Niemiec Jan
Current Estimated Value
Purchase Details
Closed on
Feb 2, 2012
Sold by
Livi Schwartz Anna
Bought by
Niemiec Anna
Purchase Details
Closed on
Aug 31, 2000
Sold by
Gordon Kathleen C
Bought by
Demma Salvatore
Home Financials for this Owner
Home Financials are based on the most recent Mortgage that was taken out on this home.
Original Mortgage
$30,000
Interest Rate
8.05%
Purchase Details
Closed on
May 9, 1995
Sold by
Myslinski Teresa
Bought by
Gordon Kathleen C
Home Financials for this Owner
Home Financials are based on the most recent Mortgage that was taken out on this home.
Original Mortgage
$83,500
Interest Rate
8.39%
Mortgage Type
FHA
Create a Home Valuation Report for This Property
The Home Valuation Report is an in-depth analysis detailing your home's value as well as a comparison with similar homes in the area
Home Values in the Area
Average Home Value in this Area
Purchase History
| Date | Buyer | Sale Price | Title Company |
|---|---|---|---|
| Niemiec Anna | -- | None Listed On Document | |
| Niemiec Anna | $60,000 | Chicago Title Insurance Co | |
| Demma Salvatore | $100,000 | -- | |
| Gordon Kathleen C | $86,000 | -- |
Source: Public Records
Mortgage History
| Date | Status | Borrower | Loan Amount |
|---|---|---|---|
| Previous Owner | Demma Salvatore | $30,000 | |
| Previous Owner | Gordon Kathleen C | $83,500 |
Source: Public Records
Tax History
| Year | Tax Paid | Tax Assessment Tax Assessment Total Assessment is a certain percentage of the fair market value that is determined by local assessors to be the total taxable value of land and additions on the property. | Land | Improvement |
|---|---|---|---|---|
| 2025 | $772 | $14,304 | $1,615 | $12,689 |
| 2024 | $772 | $10,951 | $1,360 | $9,591 |
| 2023 | $762 | $10,951 | $1,360 | $9,591 |
| 2022 | $762 | $10,951 | $1,360 | $9,591 |
| 2021 | $629 | $8,570 | $892 | $7,678 |
| 2020 | $1,759 | $8,570 | $892 | $7,678 |
| 2019 | $1,796 | $9,635 | $892 | $8,743 |
| 2018 | $1,362 | $7,659 | $764 | $6,895 |
| 2017 | $1,353 | $7,659 | $764 | $6,895 |
| 2016 | $1,519 | $7,659 | $764 | $6,895 |
| 2015 | $1,370 | $6,997 | $679 | $6,318 |
| 2014 | $1,538 | $7,597 | $679 | $6,918 |
| 2013 | $1,483 | $7,597 | $679 | $6,918 |
Source: Public Records
Map
Nearby Homes
- 5001 Carriageway Dr Unit 215
- 5000 Carriageway Dr Unit 305
- 5000 Carriageway Dr Unit 315
- 5000 Carriageway Dr Unit 211
- 2504 Algonquin Rd Unit 14
- 2402 Algonquin Rd Unit 9
- 2830 Northampton Dr Unit A1
- 1363 S Old Wilke Rd Unit 27
- 1227 S Old Wilke Rd Unit 201
- 1227 S Old Wilke Rd Unit 306
- 5400 Astor Ln Unit 116
- 1322 S New Wilke Rd Unit 1C
- 5450 Astor Ln Unit 104
- 5450 Astor Ln Unit 415
- 1117 S Old Wilke Rd Unit 206
- 1126 S New Wilke Rd Unit 307
- 1107 S Old Wilke Rd Unit 103
- 2302 Fulle St
- 3712 Jay Ln
- 3710 Meadow Dr
- 5101 Carriageway Dr
- 5101 Carriageway Dr Unit 205
- 5101 Carriageway Dr Unit 307
- 5101 Carriageway Dr Unit 107
- 5101 Carriageway Dr Unit B11
- 5101 Carriageway Dr Unit 115
- 5101 Carriageway Dr Unit B31
- 5101 Carriageway Dr Unit 100
- 5101 Carriageway Dr Unit B31
- 5101 Carriageway Dr Unit B20
- 5101 Carriageway Dr Unit B31
- 5101 Carriageway Dr Unit B20
- 5101 Carriageway Dr Unit B30
- 5101 Carriageway Dr Unit 99
- 5101 Carriageway Dr Unit B30
- 5101 Carriageway Dr Unit B10
- 5101 Carriageway Dr Unit 69
- 5101 Carriageway Dr Unit 104
- 5101 Carriageway Dr Unit 58
- 5101 Carriageway Dr Unit 62
Your Personal Tour Guide
Ask me questions while you tour the home.