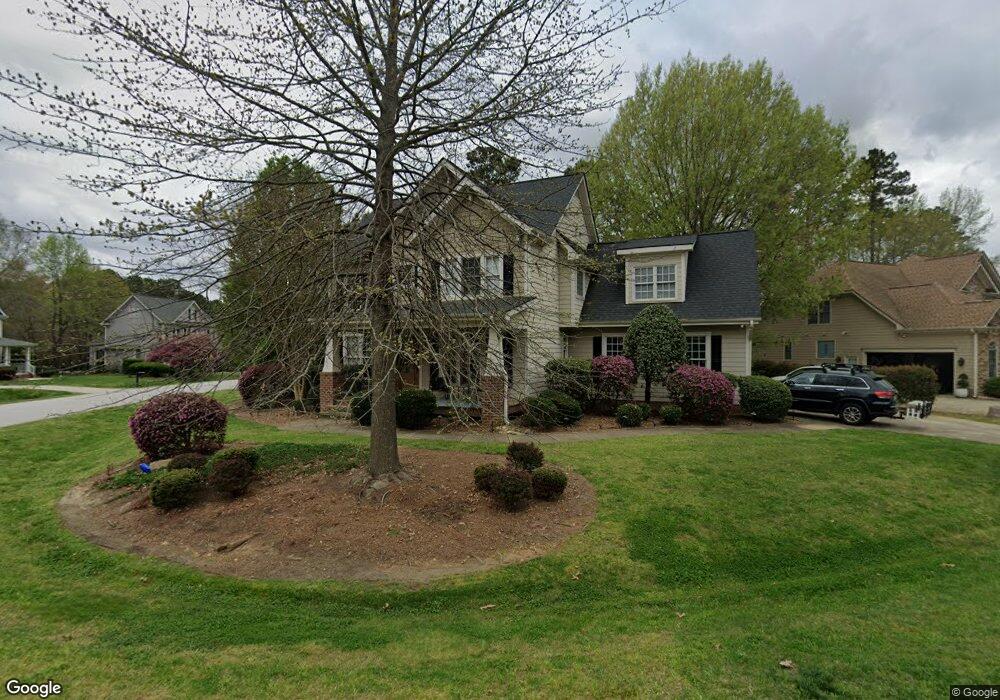
5101 Dove Forest Ln Apex, NC 27539
Middle Creek NeighborhoodEstimated Value: $707,999 - $748,000
4
Beds
3
Baths
3,099
Sq Ft
$236/Sq Ft
Est. Value
About This Home
This home is located at 5101 Dove Forest Ln, Apex, NC 27539 and is currently estimated at $731,250, approximately $235 per square foot. 5101 Dove Forest Ln is a home located in Wake County with nearby schools including West Lake Elementary School, West Lake Middle, and Middle Creek High.
Ownership History
Date
Name
Owned For
Owner Type
Purchase Details
Closed on
Jun 23, 2015
Sold by
Vincent Mark and Vincent Lezleigh K
Bought by
Talbot Christopher J and Talbot Anna Maria Jill
Current Estimated Value
Home Financials for this Owner
Home Financials are based on the most recent Mortgage that was taken out on this home.
Original Mortgage
$318,800
Outstanding Balance
$248,408
Interest Rate
3.92%
Mortgage Type
New Conventional
Estimated Equity
$482,842
Purchase Details
Closed on
May 12, 2006
Sold by
Heavenly Homes Kevin R Swartz Inc
Bought by
Vincent Mark and Vincent Lezleigh K
Home Financials for this Owner
Home Financials are based on the most recent Mortgage that was taken out on this home.
Original Mortgage
$283,920
Interest Rate
5.87%
Mortgage Type
Purchase Money Mortgage
Create a Home Valuation Report for This Property
The Home Valuation Report is an in-depth analysis detailing your home's value as well as a comparison with similar homes in the area
Home Values in the Area
Average Home Value in this Area
Purchase History
| Date | Buyer | Sale Price | Title Company |
|---|---|---|---|
| Talbot Christopher J | $398,500 | Attorney | |
| Vincent Mark | $355,000 | None Available | |
| Heavenly Homes Kevin R Swartz Inc | -- | None Available |
Source: Public Records
Mortgage History
| Date | Status | Borrower | Loan Amount |
|---|---|---|---|
| Open | Talbot Christopher J | $318,800 | |
| Previous Owner | Heavenly Homes Kevin R Swartz Inc | $283,920 |
Source: Public Records
Tax History Compared to Growth
Tax History
| Year | Tax Paid | Tax Assessment Tax Assessment Total Assessment is a certain percentage of the fair market value that is determined by local assessors to be the total taxable value of land and additions on the property. | Land | Improvement |
|---|---|---|---|---|
| 2025 | $5,831 | $677,973 | $145,000 | $532,973 |
| 2024 | $5,705 | $677,973 | $145,000 | $532,973 |
| 2023 | $4,397 | $436,871 | $85,000 | $351,871 |
| 2022 | $4,234 | $436,871 | $85,000 | $351,871 |
| 2021 | $4,148 | $436,871 | $85,000 | $351,871 |
| 2020 | $4,170 | $436,871 | $85,000 | $351,871 |
| 2019 | $4,345 | $403,967 | $85,000 | $318,967 |
| 2018 | $4,077 | $403,967 | $85,000 | $318,967 |
| 2017 | $3,918 | $403,967 | $85,000 | $318,967 |
| 2016 | $3,860 | $403,967 | $85,000 | $318,967 |
| 2015 | $4,078 | $412,220 | $75,000 | $337,220 |
| 2014 | -- | $412,220 | $75,000 | $337,220 |
Source: Public Records
Map
Nearby Homes
- 6025 Larboard Dr
- 333 Calvander Ln
- 120 Corapeake Way
- 124 Corapeake Way
- 128 Corapeake Way
- 104 Corapeake Way
- 8401 Piney Branch Dr
- 7404 Bedford Ridge Dr
- 3408 Sawyers Mill Dr
- 3101 Sawyers Mill Dr
- 5045 Homeplace Dr
- 804 Blue Thorn Dr
- 5340 Serene Forest Dr
- 3712 Sawyers Mill Dr
- 8405 Bells Lake Rd
- 8224 Bells Lake Rd
- 8220 Bells Lake Rd
- 212 Sea Biscuit Ln Unit 25
- 409 Wanderview Ln
- 3601 Lebrun Path Unit 26 Eldorado Cr
- 5105 Dove Forest Ln
- 7401 Capulin Crest Dr
- 6004 Larboard Dr
- 7417 Capulin Crest Dr
- 6008 Larboard Dr
- 5009 Serene Forest Dr
- 7404 Capulin Crest Dr
- 7408 Capulin Crest Dr
- 5104 Dove Forest Ln
- 6004 Larboard Dr
- 7412 Capulin Crest Dr
- 6000 Larboard Dr
- 6012 Larboard Dr
- 5112 Dove Forest Ln
- 5113 Dove Forest Ln
- 7381 Capulin Crest Dr
- 7384 Capulin Crest Dr
- 6016 Larboard Dr
- 5116 Dove Forest Ln
- 7001 Capulin Crest Dr