Estimated Value: $440,000 - $480,000
4
Beds
3
Baths
2,373
Sq Ft
$193/Sq Ft
Est. Value
About This Home
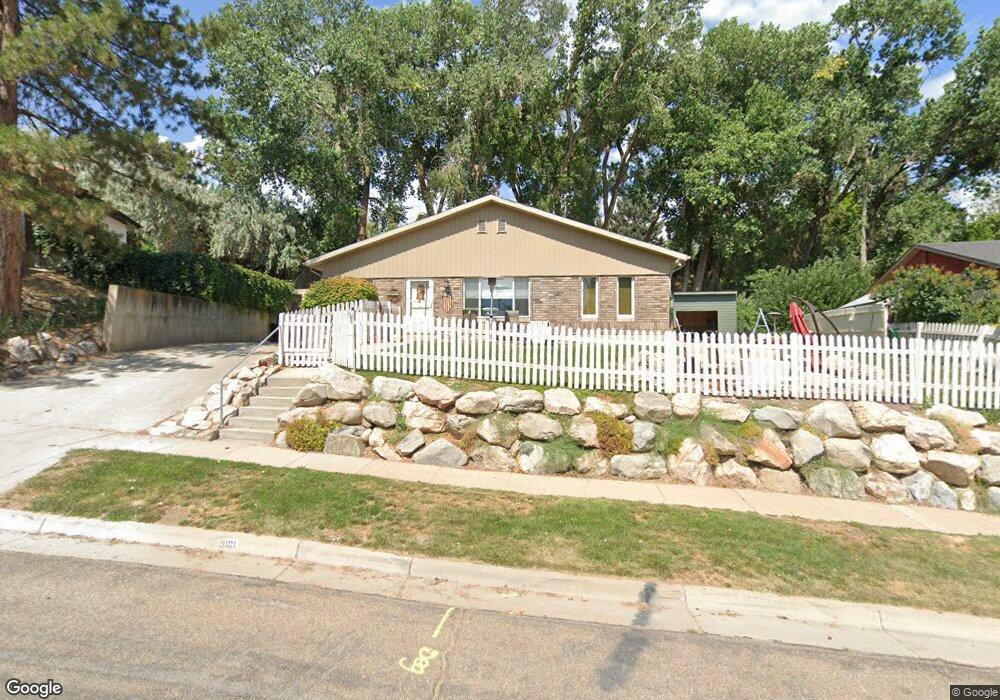
This home is located at 5101 S 1225 W, Ogden, UT 84405 and is currently estimated at $457,772, approximately $192 per square foot. 5101 S 1225 W is a home located in Weber County with nearby schools including Washington Terrace School, T.H. Bell Junior High School, and Bonneville High School.
Ownership History
Date
Name
Owned For
Owner Type
Purchase Details
Closed on
Jan 14, 2016
Sold by
Bearor Bryan C
Bought by
Bearor Bryan C
Current Estimated Value
Home Financials for this Owner
Home Financials are based on the most recent Mortgage that was taken out on this home.
Original Mortgage
$204,300
Outstanding Balance
$162,164
Interest Rate
3.9%
Mortgage Type
VA
Estimated Equity
$295,608
Purchase Details
Closed on
Jan 13, 2016
Sold by
Smith Scott M and Smith Karlinda
Bought by
Bearor Bryan C
Home Financials for this Owner
Home Financials are based on the most recent Mortgage that was taken out on this home.
Original Mortgage
$204,300
Outstanding Balance
$162,164
Interest Rate
3.9%
Mortgage Type
VA
Estimated Equity
$295,608
Purchase Details
Closed on
May 21, 2001
Sold by
Hinds Steven W and Hinds Trina K
Bought by
Smith Scott
Home Financials for this Owner
Home Financials are based on the most recent Mortgage that was taken out on this home.
Original Mortgage
$108,000
Interest Rate
7.06%
Mortgage Type
Purchase Money Mortgage
Create a Home Valuation Report for This Property
The Home Valuation Report is an in-depth analysis detailing your home's value as well as a comparison with similar homes in the area
Home Values in the Area
Average Home Value in this Area
Purchase History
| Date | Buyer | Sale Price | Title Company |
|---|---|---|---|
| Bearor Bryan C | -- | First American Title | |
| Bearor Bryan C | -- | Us Title Insurance Agency | |
| Smith Scott | -- | Inwest Title Services Inc |
Source: Public Records
Mortgage History
| Date | Status | Borrower | Loan Amount |
|---|---|---|---|
| Open | Bearor Bryan C | $204,300 | |
| Previous Owner | Smith Scott | $108,000 |
Source: Public Records
Tax History Compared to Growth
Tax History
| Year | Tax Paid | Tax Assessment Tax Assessment Total Assessment is a certain percentage of the fair market value that is determined by local assessors to be the total taxable value of land and additions on the property. | Land | Improvement |
|---|---|---|---|---|
| 2025 | $2,227 | $420,784 | $146,018 | $274,766 |
| 2024 | $2,227 | $221,649 | $80,309 | $141,340 |
| 2023 | $2,162 | $213,400 | $79,230 | $134,170 |
| 2022 | $2,267 | $228,251 | $62,453 | $165,798 |
| 2021 | $1,529 | $313,000 | $73,279 | $239,721 |
| 2020 | $1,529 | $273,000 | $72,735 | $200,265 |
| 2019 | $1,529 | $246,000 | $44,563 | $201,437 |
| 2018 | $0 | $223,000 | $44,563 | $178,437 |
| 2017 | $1,416 | $208,000 | $44,563 | $163,437 |
| 2016 | $1,083 | $86,504 | $19,483 | $67,021 |
| 2015 | $932 | $72,784 | $18,949 | $53,835 |
| 2014 | $907 | $70,019 | $18,949 | $51,070 |
Source: Public Records
Map
Nearby Homes
- 1127 W 5150 S
- 5241 S 1250 W
- 1057 W 5150 S
- 1004 W Motor Vu Dr Unit 213
- Alpine Plan at Riverside Estates
- Bridger Plan at Riverside Estates
- Bordeaux Plan at Riverside Estates
- Rockwell Plan at Riverside Estates
- Summit Plan at Riverside Estates
- Abbey Plan at Riverside Estates
- 949 W Columbia Ct Unit 106
- 946 W Columbia Ct Unit 107
- 939 W Motor Vu Dr Unit 205
- 927 W Motor Vu Dr Unit 204
- 5100 S 1050 W Unit E33
- 5100 S 1050 W Unit E37
- 5100 S 1050 W Unit G109
- 5100 S 1050 W Unit A182
- 5100 S 1050 W Unit A74
- 5100 S 1050 W Unit A180