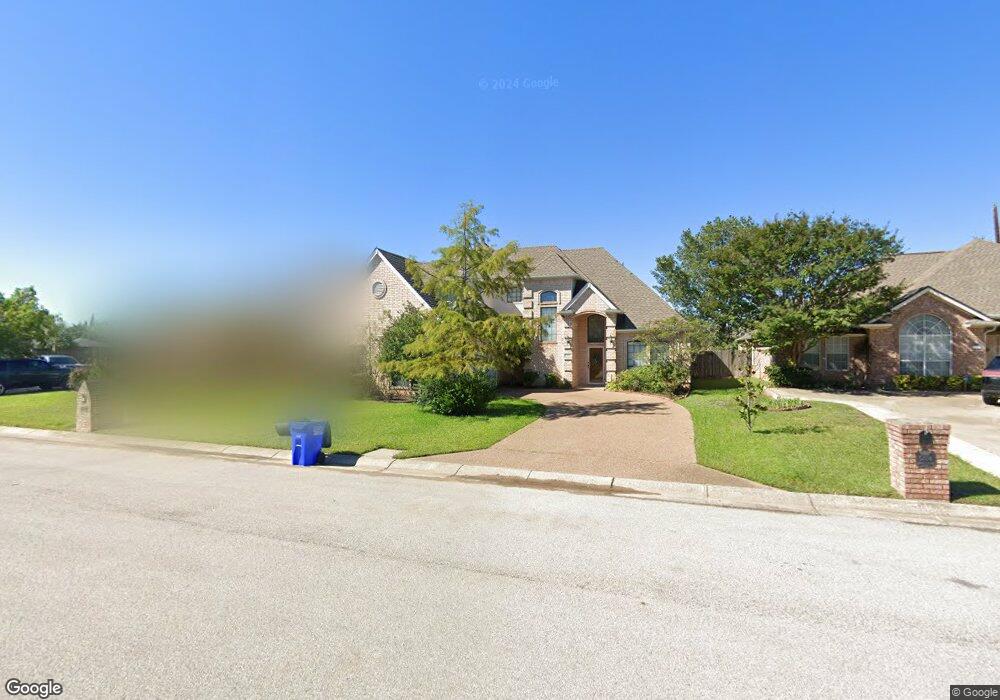
5102 Shadowood Rd Colleyville, TX 76034
Estimated Value: $586,046 - $698,000
4
Beds
2
Baths
2,611
Sq Ft
$252/Sq Ft
Est. Value
About This Home
This home is located at 5102 Shadowood Rd, Colleyville, TX 76034 and is currently estimated at $657,262, approximately $251 per square foot. 5102 Shadowood Rd is a home located in Tarrant County with nearby schools including Bransford Elementary School, Colleyville Middle School, and Grapevine High School.
Ownership History
Date
Name
Owned For
Owner Type
Purchase Details
Closed on
Jul 27, 2006
Sold by
Shallwani Abdul Hameed
Bought by
Kherani Mohammed
Current Estimated Value
Home Financials for this Owner
Home Financials are based on the most recent Mortgage that was taken out on this home.
Original Mortgage
$205,600
Outstanding Balance
$122,767
Interest Rate
6.66%
Mortgage Type
Purchase Money Mortgage
Estimated Equity
$534,495
Purchase Details
Closed on
Jul 15, 2005
Sold by
Karamali Shadid and Karamali Farial
Bought by
Shallwani Abdul H
Purchase Details
Closed on
Feb 22, 2002
Sold by
Logan John Leray and Logan Carrie Ann
Bought by
Karamali Shahid
Home Financials for this Owner
Home Financials are based on the most recent Mortgage that was taken out on this home.
Original Mortgage
$174,600
Interest Rate
7.05%
Purchase Details
Closed on
Aug 3, 2001
Sold by
Logan Marikay
Bought by
Logan John Leray and Logan Carrie Ann
Create a Home Valuation Report for This Property
The Home Valuation Report is an in-depth analysis detailing your home's value as well as a comparison with similar homes in the area
Home Values in the Area
Average Home Value in this Area
Purchase History
| Date | Buyer | Sale Price | Title Company |
|---|---|---|---|
| Kherani Mohammed | -- | Title Texas | |
| Shallwani Abdul H | -- | -- | |
| Karamali Shahid | -- | Alamo Title Company | |
| Logan John Leray | -- | -- |
Source: Public Records
Mortgage History
| Date | Status | Borrower | Loan Amount |
|---|---|---|---|
| Open | Kherani Mohammed | $205,600 | |
| Previous Owner | Karamali Shahid | $174,600 |
Source: Public Records
Tax History Compared to Growth
Tax History
| Year | Tax Paid | Tax Assessment Tax Assessment Total Assessment is a certain percentage of the fair market value that is determined by local assessors to be the total taxable value of land and additions on the property. | Land | Improvement |
|---|---|---|---|---|
| 2025 | $1,450 | $482,604 | $81,800 | $400,804 |
| 2024 | $1,450 | $547,140 | $81,800 | $465,340 |
| 2023 | $7,794 | $529,217 | $81,800 | $447,417 |
| 2022 | $8,295 | $422,513 | $81,800 | $340,713 |
| 2021 | $8,385 | $392,394 | $49,080 | $343,314 |
| 2020 | $7,713 | $347,123 | $49,080 | $298,043 |
| 2019 | $7,401 | $323,577 | $45,000 | $278,577 |
| 2018 | $1,340 | $291,006 | $45,000 | $246,006 |
| 2017 | $6,506 | $292,215 | $45,000 | $247,215 |
| 2016 | $5,915 | $287,275 | $45,000 | $242,275 |
| 2015 | $5,076 | $227,600 | $34,000 | $193,600 |
| 2014 | $5,076 | $227,600 | $34,000 | $193,600 |
Source: Public Records
Map
Nearby Homes
- 5104 Shadowood Rd
- 2116 Cottage Oak Ln
- 1921 Maplewood Trail
- 37 Piazza Ln
- 34 Piazza Ln Unit 37
- 407 Timberline Dr N
- 217 Oak Valley Dr
- 203 Oak Valley Dr
- 114 Glade Rd
- 112 Glade Rd
- 4600 Bransford Rd
- 1104 Garry Lynne Dr
- 4600 Westbury Dr
- 5104 Preservation Ave
- 5609 Oak Top Dr
- 5200 Preservation Ave
- 4812 Carmel Place
- 1521 Four Seasons Dr
- 1505 Four Seasons Dr
- 1504 Four Seasons Dr
- 5100 Shadowood Rd
- 5103 Indian Trail Ct
- 5101 Indian Trail Ct
- 5105 Indian Trail Ct
- 5007 Shadowood Rd
- 5005 Shadowood Rd
- 5004 Shadowood Rd
- 5005 Shadowood Trail
- 2203 Cottage Oak Ln
- 5003 Shadowood Rd
- 5002 Shadowood Rd
- 5102 Indian Trail Ct
- 5003 Shadowood Trail
- 5004 Shadowood Trail
- 2201 Cottage Oak Ln
- 5001 Shadowood Rd
- 5001 Shadowood Trail
- 5000 Shadowood Rd
- 5002 Shadowood Trail
- 2200 Cottage Oak Ln