Estimated Value: $307,167 - $496,000
4
Beds
3
Baths
2,984
Sq Ft
$127/Sq Ft
Est. Value
About This Home
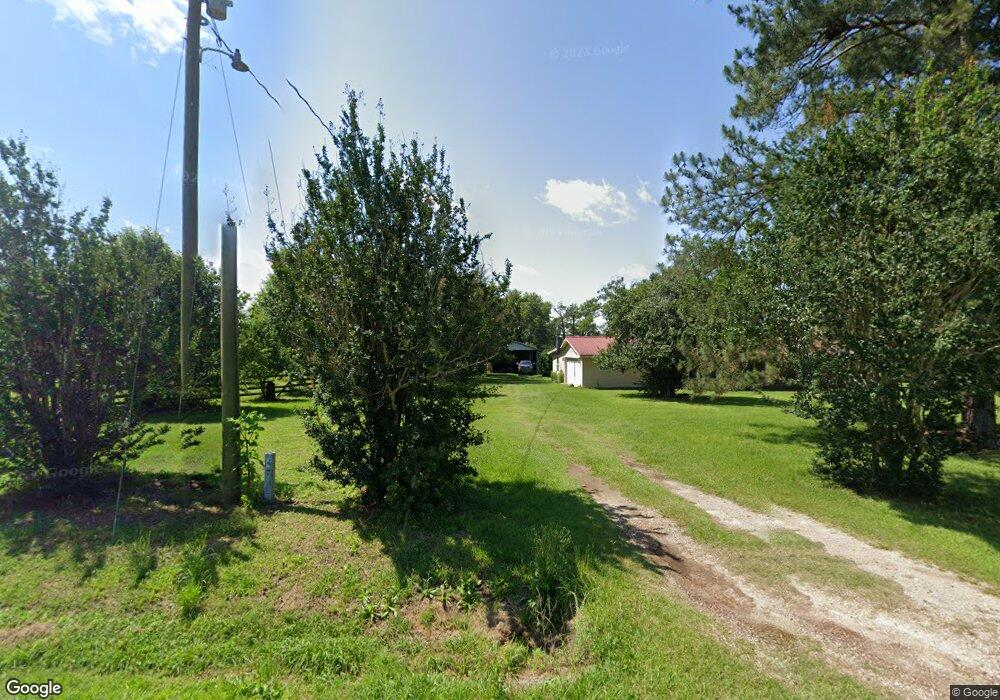
This home is located at 5103 Ione Rd, Pavo, GA 31778 and is currently estimated at $379,292, approximately $127 per square foot. 5103 Ione Rd is a home located in Thomas County with nearby schools including Hand in Hand Primary School, Garrison-Pilcher Elementary School, and Cross Creek Elementary School.
Ownership History
Date
Name
Owned For
Owner Type
Purchase Details
Closed on
Dec 6, 2021
Sold by
Daniel Michael E
Bought by
Wesson Shelby L and Silva Zachary
Current Estimated Value
Home Financials for this Owner
Home Financials are based on the most recent Mortgage that was taken out on this home.
Original Mortgage
$317,130
Outstanding Balance
$291,598
Interest Rate
3.09%
Mortgage Type
VA
Estimated Equity
$87,694
Purchase Details
Closed on
Aug 16, 2007
Sold by
Alderman Marvin Jerry
Bought by
Daniel Michael E and Daniel Deborah A
Home Financials for this Owner
Home Financials are based on the most recent Mortgage that was taken out on this home.
Original Mortgage
$204,300
Interest Rate
6.7%
Mortgage Type
New Conventional
Purchase Details
Closed on
Sep 10, 2004
Sold by
Nash Julius C
Bought by
Alderman Marvin Jerry
Purchase Details
Closed on
Jan 31, 1978
Bought by
Nash Julius C
Create a Home Valuation Report for This Property
The Home Valuation Report is an in-depth analysis detailing your home's value as well as a comparison with similar homes in the area
Home Values in the Area
Average Home Value in this Area
Purchase History
| Date | Buyer | Sale Price | Title Company |
|---|---|---|---|
| Wesson Shelby L | $310,000 | -- | |
| Daniel Michael E | $227,000 | -- | |
| Alderman Marvin Jerry | $90,000 | -- | |
| Nash Julius C | $22,000 | -- |
Source: Public Records
Mortgage History
| Date | Status | Borrower | Loan Amount |
|---|---|---|---|
| Open | Wesson Shelby L | $317,130 | |
| Previous Owner | Daniel Michael E | $204,300 |
Source: Public Records
Tax History Compared to Growth
Tax History
| Year | Tax Paid | Tax Assessment Tax Assessment Total Assessment is a certain percentage of the fair market value that is determined by local assessors to be the total taxable value of land and additions on the property. | Land | Improvement |
|---|---|---|---|---|
| 2024 | $2,157 | $106,227 | $31,124 | $75,103 |
| 2023 | $1,864 | $94,204 | $24,899 | $69,305 |
| 2022 | $1,820 | $83,506 | $24,899 | $58,607 |
| 2021 | $1,700 | $71,106 | $21,651 | $49,455 |
| 2020 | $1,707 | $69,643 | $21,651 | $47,992 |
| 2019 | $1,725 | $69,643 | $21,651 | $47,992 |
| 2018 | $1,746 | $69,058 | $21,651 | $47,407 |
| 2017 | $1,761 | $68,611 | $21,651 | $46,960 |
| 2016 | $1,756 | $67,937 | $21,651 | $46,286 |
| 2015 | $1,751 | $66,740 | $21,651 | $45,089 |
| 2014 | $1,733 | $65,769 | $21,651 | $44,118 |
| 2013 | -- | $65,769 | $21,651 | $44,118 |
Source: Public Records
Map
Nearby Homes
- 16343 Georgia 33
- 16343 Ga Hwy 33 -8 34 Acres
- 16343
- 16343 Ga Hwy 33 - 8 34 Acres Hwy
- 2051 W Pear St
- 1230 Parrish Rd
- 2055 S Roberts St
- 0 Upper Trail Unit 913421
- 0 Upper Trail Unit 913422
- 1557 US Highway 319 S
- xx Ga Hwy 319 N
- 182 Horseshoe Dr
- 00 Ragin Rd Unit 7
- 00 Ragin Rd Unit 12
- 813 Vonier Road (6 Acres)
- 258
- 13876 Ga Highway 122
- XX Us Highway 319 S Unit 8-11
- 117 Will Rd
- 1136 Nesbitt Rd
- 5183 Ione Rd
- 4951 Ione Rd
- 5242 Ione Rd
- 5384 Ione Rd
- 5426 Ione Rd
- 18368 Ga Highway 33
- 18402 Ga Highway 33
- 5564 Ione Rd
- 5550 Ione Rd
- 4743 Ione Rd
- 18898 Ga Highway 33
- 18958 Ga Highway 33
- 4485 Ione Rd
- 4463 Ione Rd
- 4367 Ione Rd
- 19286 Ga Highway 33
- 19286 Ga Highway 33
- 4576 Ione Rd
- 19268 Ga Highway 33
- 4216 Ione Rd