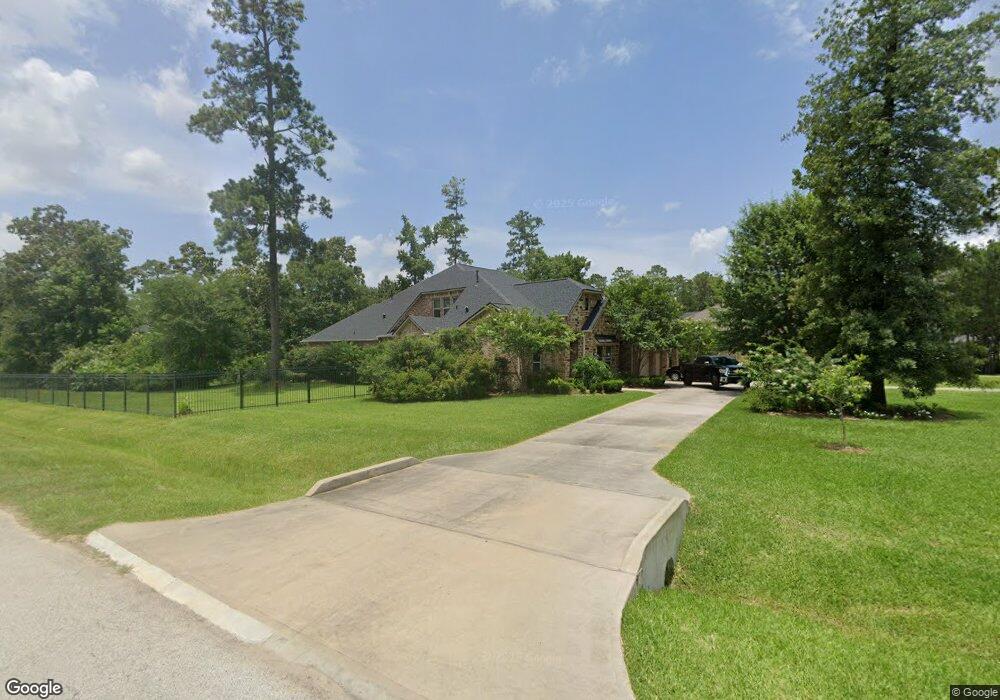
5103 N Ossineke Dr Spring, TX 77386
Benders Landing NeighborhoodEstimated Value: $1,033,017 - $1,244,000
4
Beds
5
Baths
4,280
Sq Ft
$260/Sq Ft
Est. Value
About This Home
This home is located at 5103 N Ossineke Dr, Spring, TX 77386 and is currently estimated at $1,113,504, approximately $260 per square foot. 5103 N Ossineke Dr is a home located in Montgomery County with nearby schools including York J High School and Grand Oaks High School.
Ownership History
Date
Name
Owned For
Owner Type
Purchase Details
Closed on
Jul 11, 2025
Sold by
Winn Alexander Lee and Winn Anna Thompson
Bought by
Alexander And Anna Winn Revocable Trust and Winn
Current Estimated Value
Purchase Details
Closed on
Jun 28, 2016
Sold by
Pedraza Martin and Pedraza Ana
Bought by
Winn Alexander Lee
Home Financials for this Owner
Home Financials are based on the most recent Mortgage that was taken out on this home.
Original Mortgage
$265,000
Interest Rate
3.58%
Mortgage Type
New Conventional
Purchase Details
Closed on
Dec 15, 2009
Sold by
Bank Of America Na
Bought by
Pedraza Martin
Purchase Details
Closed on
Jul 7, 2009
Sold by
Mough Jonathan A
Bought by
Bank Of America Na
Purchase Details
Closed on
Mar 29, 2007
Sold by
Lgi Land Llc
Bought by
Mough Jonathan A
Home Financials for this Owner
Home Financials are based on the most recent Mortgage that was taken out on this home.
Original Mortgage
$71,910
Interest Rate
6.3%
Mortgage Type
Purchase Money Mortgage
Create a Home Valuation Report for This Property
The Home Valuation Report is an in-depth analysis detailing your home's value as well as a comparison with similar homes in the area
Home Values in the Area
Average Home Value in this Area
Purchase History
| Date | Buyer | Sale Price | Title Company |
|---|---|---|---|
| Alexander And Anna Winn Revocable Trust | -- | None Listed On Document | |
| Winn Alexander Lee | -- | Capital Title | |
| Pedraza Martin | -- | Lsi Title Agency Inc | |
| Bank Of America Na | $45,000 | None Available | |
| Mough Jonathan A | -- | American Title Co |
Source: Public Records
Mortgage History
| Date | Status | Borrower | Loan Amount |
|---|---|---|---|
| Previous Owner | Winn Alexander Lee | $265,000 | |
| Previous Owner | Mough Jonathan A | $71,910 |
Source: Public Records
Tax History Compared to Growth
Tax History
| Year | Tax Paid | Tax Assessment Tax Assessment Total Assessment is a certain percentage of the fair market value that is determined by local assessors to be the total taxable value of land and additions on the property. | Land | Improvement |
|---|---|---|---|---|
| 2025 | $11,639 | $865,637 | $344,782 | $520,855 |
| 2024 | $11,639 | $853,002 | -- | -- |
| 2023 | $10,472 | $775,460 | $213,540 | $641,710 |
| 2022 | $12,232 | $704,960 | $193,340 | $576,230 |
| 2021 | $11,848 | $640,870 | $117,890 | $522,980 |
| 2020 | $11,583 | $595,780 | $117,890 | $477,890 |
| 2019 | $11,988 | $595,130 | $140,140 | $454,990 |
| 2018 | $10,729 | $582,140 | $140,140 | $442,000 |
| 2017 | $11,710 | $582,140 | $140,140 | $442,000 |
| 2016 | $11,597 | $576,490 | $140,140 | $436,350 |
| 2015 | $8,365 | $576,490 | $140,140 | $436,350 |
| 2014 | $8,365 | $411,670 | $95,650 | $316,020 |
Source: Public Records
Map
Nearby Homes
- 4904 Northern Woods Dr
- 27919 Hansons Ct
- 27918 Hansons Ct
- 4911 Ontonagon Way
- 27919 Inspire Crest Landing
- 5514 Harvest Oak Landing Dr
- 5346 Pine Wood Hills Ct
- 5338 Pine Wood Hills Ct
- 27618 Siandra Creek Ln
- 5006 Newport Ct
- 27322 Whispering Maple Way
- 5361 Cherry Spring Dr
- 27318 Whispering Maple Way
- 28337 Sterling Oak Dr
- 5603 White Birch
- 28228 Cedar Peak Dr
- 4510 Siandra Creek Ct
- 5217 Liberty Cove Dr
- 28212 Cedar Peak Dr
- 4502 Siandra Creek Ct
- 5107 N Ossineke Dr
- 0 N Ossineke Dr Unit 51503314
- 5107 Ossineke Ct
- 5110 Ossineke Ct
- 5102 N Ossineke Dr
- 5111 N Ossineke Dr
- 5014 N Ossineke Dr
- 5110 N Ossineke Dr
- 5102 Ossineke Ct
- 5115 N Ossineke Dr
- 5119 N Ossineke Dr
- 5010 N Ossineke Dr
- 5010 N Ossineke Dr
- 5118 N Ossineke Dr
- 5014 Ossineke Ct
- 5017 Ossineke Ct
- 5016 Ossineke Ct
- 28111 Whispering Maple Way
- 28107 Whispering Maple Way
- 28203 Whispering Maple Way