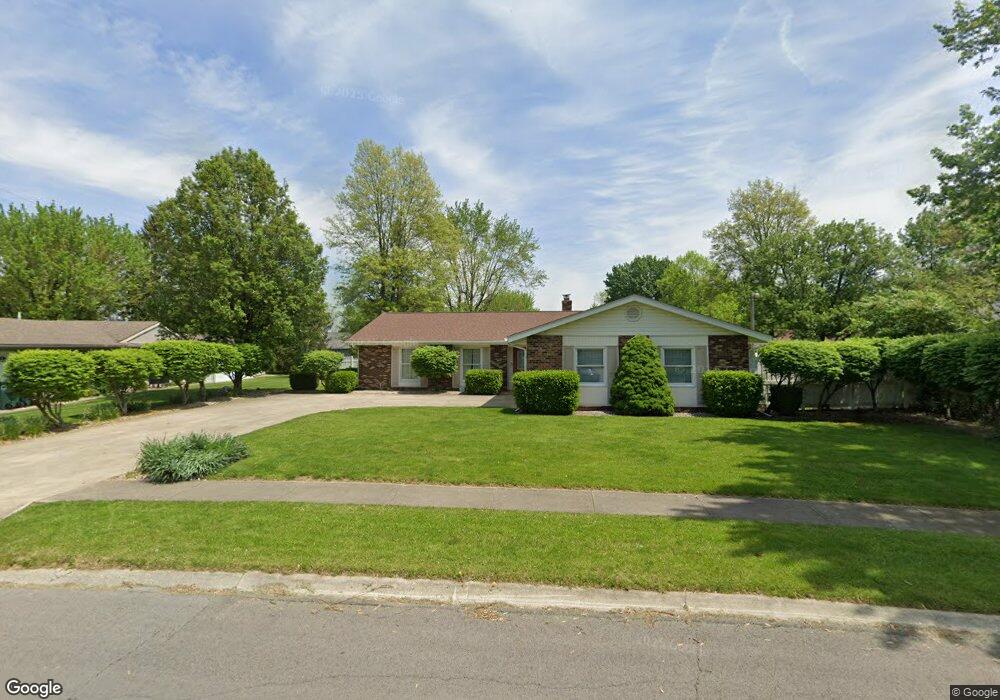
5104 N Weir Dr Muncie, IN 47304
Estimated Value: $233,000
3
Beds
2
Baths
1,592
Sq Ft
$146/Sq Ft
Est. Value
About This Home
This home is located at 5104 N Weir Dr, Muncie, IN 47304 and is currently priced at $233,000, approximately $146 per square foot. 5104 N Weir Dr is a home located in Delaware County with nearby schools including Royerton Elementary School, Delta Middle School, and Delta High School.
Ownership History
Date
Name
Owned For
Owner Type
Purchase Details
Closed on
Aug 10, 2017
Sold by
Hall Abigayle Scroggins
Bought by
Sorrell Bradley C and Sorrell Priscilla M
Current Estimated Value
Home Financials for this Owner
Home Financials are based on the most recent Mortgage that was taken out on this home.
Original Mortgage
$50,000
Outstanding Balance
$26,806
Interest Rate
4.03%
Mortgage Type
New Conventional
Purchase Details
Closed on
Apr 6, 2017
Sold by
Armantrout Lori
Bought by
Hall Abigayle
Purchase Details
Closed on
May 8, 2014
Sold by
Scroggins Michael S
Bought by
Scroggins Michael S and Armantrout Lor A
Purchase Details
Closed on
Aug 16, 2013
Sold by
Long Helen and Winningham James
Bought by
Scroggins Michael S
Home Financials for this Owner
Home Financials are based on the most recent Mortgage that was taken out on this home.
Original Mortgage
$108,007
Interest Rate
4.5%
Mortgage Type
FHA
Create a Home Valuation Report for This Property
The Home Valuation Report is an in-depth analysis detailing your home's value as well as a comparison with similar homes in the area
Home Values in the Area
Average Home Value in this Area
Purchase History
| Date | Buyer | Sale Price | Title Company |
|---|---|---|---|
| Sorrell Bradley C | -- | -- | |
| Hall Abigayle | -- | -- | |
| Scroggins Michael S | -- | -- | |
| Scroggins Michael S | -- | Youngs Title |
Source: Public Records
Mortgage History
| Date | Status | Borrower | Loan Amount |
|---|---|---|---|
| Open | Sorrell Bradley C | $50,000 | |
| Previous Owner | Scroggins Michael S | $108,007 |
Source: Public Records
Tax History Compared to Growth
Tax History
| Year | Tax Paid | Tax Assessment Tax Assessment Total Assessment is a certain percentage of the fair market value that is determined by local assessors to be the total taxable value of land and additions on the property. | Land | Improvement |
|---|---|---|---|---|
| 2023 | $3,470 | $167,400 | $32,900 | $134,500 |
| 2022 | $3,577 | $172,800 | $32,900 | $139,900 |
| 2020 | $2,888 | $138,200 | $31,200 | $107,000 |
| 2019 | -- | $138,200 | $31,200 | $107,000 |
| 2018 | -- | $133,100 | $31,200 | $101,900 |
| 2017 | -- | $132,600 | $29,200 | $103,400 |
| 2016 | -- | $123,300 | $27,800 | $95,500 |
| 2014 | -- | $118,700 | $27,800 | $90,900 |
| 2013 | -- | $117,700 | $27,800 | $89,900 |
Source: Public Records
Map
Nearby Homes
- 5205 N Grass Way
- 0 N Moore Rd Unit 202532976
- 3400 W Riggin Rd Unit 48
- 4110 W Heath Dr
- 4808 N Camelot Dr
- 3209 W Twickingham Dr
- 4310 N Morrison Rd
- 2905 W Woodbridge Dr
- 5210 W Stone Bridge Dr
- 5212 W Shoreline Terrace
- 3802 N Lakeside Dr
- 3603 N Lakeside Dr
- 3736 N Lakeside Dr
- 2805 W Preserve Ln
- 4401 N Redding Rd
- 2508 W Twickingham Dr
- 4609 W Clearlake Ct
- 4501 N Wheeling Ave Unit 3-106
- 0 N Morrison Rd
- 2609 W Lincolnshire Dr
- 5100 N Weir Dr
- 5108 N Weir Dr
- 5105 N Leslie Dr
- 5101 N Leslie Dr
- 5115 N Leslie Dr
- 5101 N Weir Dr
- 5010 N Weir Dr
- 5013 N Weir Dr
- 3909 W Thornburg Dr
- 4101 W Freeman Ln
- 5108 N Leslie Dr
- 5112 N Leslie Dr
- 5009 N Weir Dr
- 3900 W Thornburg Dr
- 3905 W Thornburg Dr
- 5006 N Weir Dr
- 5116 N Leslie Dr
- 5012 N Sollars Dr
- 5005 N Weir Dr
- 5008 N Sollars Dr