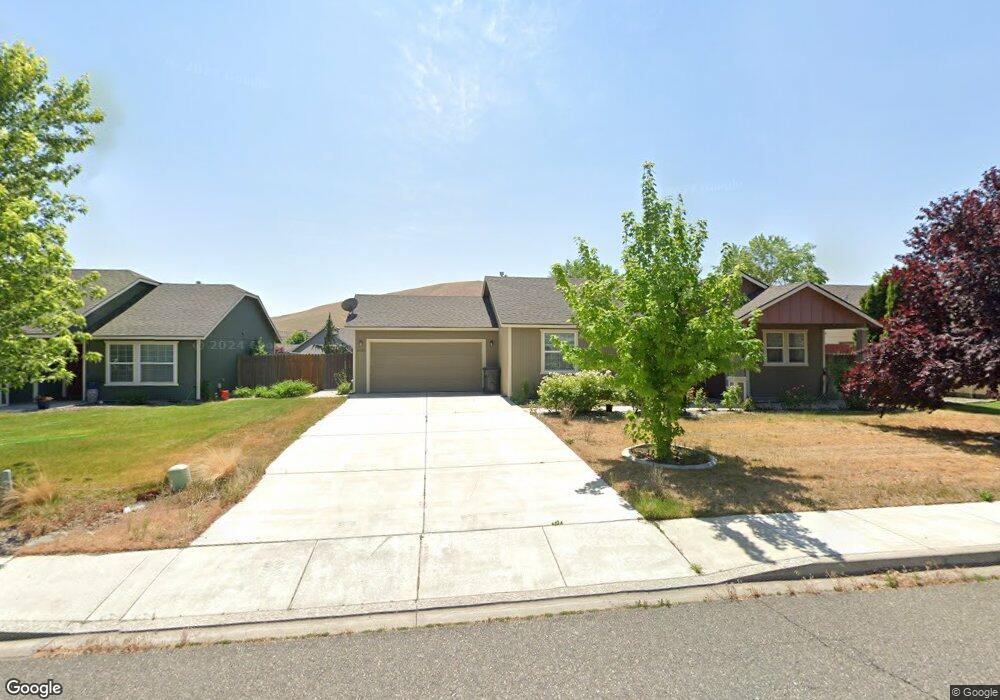
5105 Spirea Dr Unit Open Floor Plan Ramb West Richland, WA 99353
Estimated Value: $372,000 - $446,000
3
Beds
2
Baths
1,247
Sq Ft
$317/Sq Ft
Est. Value
About This Home
This home is located at 5105 Spirea Dr Unit Open Floor Plan Ramb, West Richland, WA 99353 and is currently estimated at $395,141, approximately $316 per square foot. 5105 Spirea Dr Unit Open Floor Plan Ramb is a home located in Benton County with nearby schools including Wiley Elementary School, Enterprise Middle School, and Hanford High School.
Ownership History
Date
Name
Owned For
Owner Type
Purchase Details
Closed on
Oct 15, 2018
Sold by
Rittenhouse Krystal and Short Krystal S
Bought by
King Jay and Liu May
Current Estimated Value
Home Financials for this Owner
Home Financials are based on the most recent Mortgage that was taken out on this home.
Original Mortgage
$243,117
Outstanding Balance
$212,012
Interest Rate
4.5%
Mortgage Type
VA
Estimated Equity
$183,129
Purchase Details
Closed on
Jul 14, 2016
Sold by
Harless Kristi S
Bought by
Short Krystal S
Home Financials for this Owner
Home Financials are based on the most recent Mortgage that was taken out on this home.
Original Mortgage
$186,558
Interest Rate
3.75%
Mortgage Type
FHA
Purchase Details
Closed on
Mar 23, 2006
Sold by
Harless Donald G
Bought by
Harless Kristi C
Purchase Details
Closed on
Dec 7, 2005
Sold by
Hayden Enterprises Inc
Bought by
Harless Donald G and Harless Kristi Carol
Home Financials for this Owner
Home Financials are based on the most recent Mortgage that was taken out on this home.
Original Mortgage
$96,000
Interest Rate
6.31%
Mortgage Type
Fannie Mae Freddie Mac
Create a Home Valuation Report for This Property
The Home Valuation Report is an in-depth analysis detailing your home's value as well as a comparison with similar homes in the area
Home Values in the Area
Average Home Value in this Area
Purchase History
| Date | Buyer | Sale Price | Title Company |
|---|---|---|---|
| King Jay | $276,889 | Ticor Title Co | |
| Short Krystal S | $190,000 | Stewart Title Company | |
| Harless Kristi C | -- | None Available | |
| Harless Donald G | $137,425 | Chicago Title |
Source: Public Records
Mortgage History
| Date | Status | Borrower | Loan Amount |
|---|---|---|---|
| Open | King Jay | $243,117 | |
| Previous Owner | Short Krystal S | $186,558 | |
| Previous Owner | Harless Donald G | $96,000 |
Source: Public Records
Tax History Compared to Growth
Tax History
| Year | Tax Paid | Tax Assessment Tax Assessment Total Assessment is a certain percentage of the fair market value that is determined by local assessors to be the total taxable value of land and additions on the property. | Land | Improvement |
|---|---|---|---|---|
| 2024 | $3,638 | $304,390 | $95,000 | $209,390 |
| 2023 | $3,638 | $309,660 | $50,000 | $259,660 |
| 2022 | $3,125 | $249,740 | $50,000 | $199,740 |
| 2021 | $2,982 | $229,770 | $50,000 | $179,770 |
| 2020 | $2,992 | $209,790 | $50,000 | $159,790 |
| 2019 | $2,410 | $203,130 | $50,000 | $153,130 |
| 2018 | $2,398 | $171,880 | $40,000 | $131,880 |
| 2017 | $2,154 | $149,900 | $40,000 | $109,900 |
| 2016 | $2,059 | $149,900 | $40,000 | $109,900 |
| 2015 | $1,989 | $149,900 | $40,000 | $109,900 |
| 2014 | -- | $143,640 | $40,000 | $103,640 |
| 2013 | -- | $143,640 | $40,000 | $103,640 |
Source: Public Records
Map
Nearby Homes
- 5200 S Desert Dove Loop
- 5002 Spirea Dr
- 3000 S Highlands Blvd
- 5007 S Desert Dove Loop
- 5258 Chris St
- 4728 Forsythia St
- 5507 Monica St
- 5600 Kirkwood Ln
- 4721 Holly Way
- 3538 Curtis Dr
- 5506 Aspen Dr
- 5103 Crane Dr
- 5705 Aspen Dr
- 6363 Keene Rd
- 6397 Keene Rd
- 6461 Keene Rd
- 1120 Keene Rd
- 3909 Curtis Dr
- 2512 Hickory Ave
- 2211 S Highlands Blvd
- 5105 Spirea Dr Unit Hurry will not last!
- 5105 Spirea Dr
- 5107 Spirea Dr
- 5103 Spirea Dr
- 5104 S Desert Dove Loop
- 3002 Hermandt Ct
- 5101 Spirea Dr
- 5201 Spirea Dr
- 5102 S Desert Dove Loop
- 5104 Spirea Dr Unit New Price!
- 5104 Spirea Dr Unit Huge Backyard!
- 5104 Spirea Dr
- 5106 Spirea Dr
- 5007 Spirea Dr
- 3004 Hermandt Ct
- 5102 Spirea Dr Unit NEW PRICE Beautiful
- 5102 Spirea Dr Unit Great West Richland
- 5102 Spirea Dr
- 5108 S Desert Dove Loop
- 5100 Spirea Dr