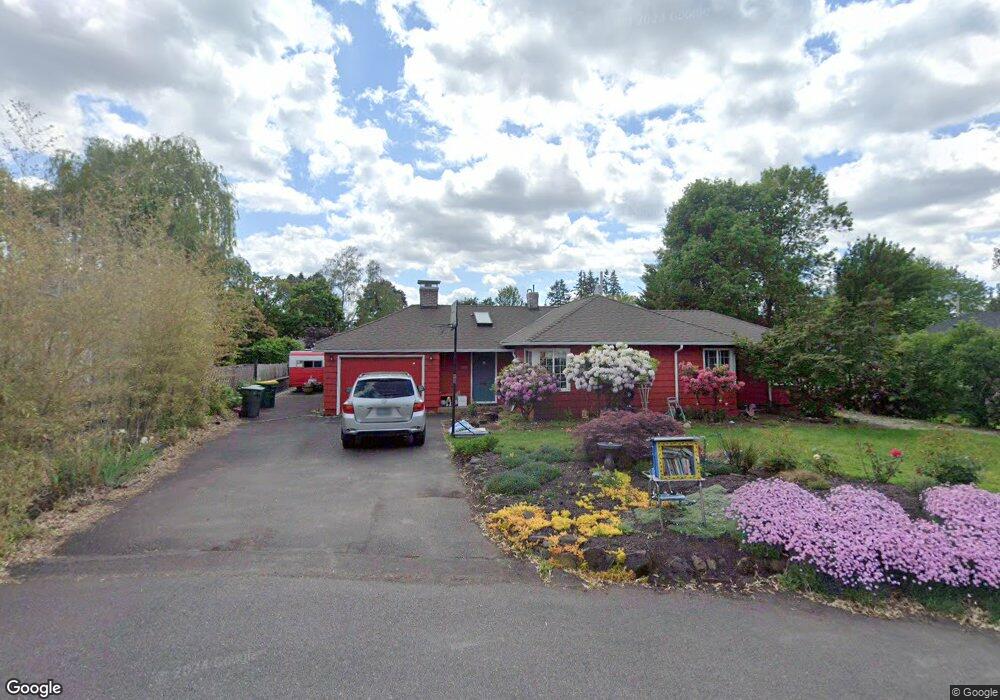
5105 SW Cherry Ave Beaverton, OR 97005
Raleigh West NeighborhoodEstimated Value: $645,000 - $702,652
4
Beds
2
Baths
2,009
Sq Ft
$338/Sq Ft
Est. Value
About This Home
This home is located at 5105 SW Cherry Ave, Beaverton, OR 97005 and is currently estimated at $678,163, approximately $337 per square foot. 5105 SW Cherry Ave is a home located in Washington County with nearby schools including Raleigh Hills Elementary School, Whitford Middle School, and Beaverton High School.
Ownership History
Date
Name
Owned For
Owner Type
Purchase Details
Closed on
Jul 26, 2022
Sold by
Patrice Scanlon
Bought by
Scanlon/Masseyfamily Trust
Current Estimated Value
Purchase Details
Closed on
Sep 15, 2003
Sold by
Allee Jack C and Allee Angela
Bought by
Massey Stuart and Scanlon Patrice
Home Financials for this Owner
Home Financials are based on the most recent Mortgage that was taken out on this home.
Original Mortgage
$180,000
Interest Rate
6.3%
Mortgage Type
Unknown
Purchase Details
Closed on
Mar 19, 2001
Sold by
Makarowsky Roman P and Makarowsky Julie
Bought by
Allee Jack C and Allee Angela
Home Financials for this Owner
Home Financials are based on the most recent Mortgage that was taken out on this home.
Original Mortgage
$154,413
Interest Rate
6.97%
Create a Home Valuation Report for This Property
The Home Valuation Report is an in-depth analysis detailing your home's value as well as a comparison with similar homes in the area
Home Values in the Area
Average Home Value in this Area
Purchase History
| Date | Buyer | Sale Price | Title Company |
|---|---|---|---|
| Scanlon/Masseyfamily Trust | -- | None Listed On Document | |
| Massey Stuart | $225,000 | First American | |
| Allee Jack C | $199,900 | Fidelity National Title Co |
Source: Public Records
Mortgage History
| Date | Status | Borrower | Loan Amount |
|---|---|---|---|
| Previous Owner | Massey Stuart | $180,000 | |
| Previous Owner | Allee Jack C | $154,413 |
Source: Public Records
Tax History Compared to Growth
Tax History
| Year | Tax Paid | Tax Assessment Tax Assessment Total Assessment is a certain percentage of the fair market value that is determined by local assessors to be the total taxable value of land and additions on the property. | Land | Improvement |
|---|---|---|---|---|
| 2026 | $7,312 | $356,950 | -- | -- |
| 2025 | $7,312 | $346,560 | -- | -- |
| 2024 | $6,903 | $336,470 | -- | -- |
| 2023 | $6,903 | $326,670 | $0 | $0 |
| 2022 | $6,607 | $326,670 | $0 | $0 |
| 2021 | $6,376 | $307,930 | $0 | $0 |
| 2020 | $6,182 | $298,970 | $0 | $0 |
| 2019 | $5,987 | $290,270 | $0 | $0 |
| 2018 | $5,796 | $281,820 | $0 | $0 |
| 2017 | $5,429 | $266,260 | $0 | $0 |
| 2016 | $4,591 | $226,490 | $0 | $0 |
| 2015 | $4,421 | $219,900 | $0 | $0 |
| 2014 | $4,327 | $213,500 | $0 | $0 |
Source: Public Records
Map
Nearby Homes
- 4800 SW Chestnut Place
- 9355 SW Jamieson Rd
- 10090 SW Beaverton Hillsdale Hwy Unit 13
- 10090 SW Beaverton Hillsdale Hwy Unit 16
- 4387 SW 94th Ave Unit 3
- 9360 SW Meadow Ln
- 8920 SW Jamieson Rd
- 5805 SW Arrow Wood Ln
- 6025 SW Spruce Ave
- 8955 SW Club Meadow Ln
- 4060 SW 96th Ave
- 4180 SW 103rd Ct
- 5455 SW 87th Ave
- 6075 SW Arrow Wood Ln
- 6220 SW Spruce Ave
- 8725 SW White Pine Ln
- 3760 SW 96th Ave
- 5436 SW Champion Place
- 5555 SW Scholls Ferry Rd
- 4420 SW Crestwood Dr
- 9750 SW Cypress St
- 5125 SW Cherry Ave
- 5210 SW Chestnut Ave
- 5190 SW Chestnut Ave
- 5230 SW Chestnut Ave
- 9670 SW Cypress St
- 5155 SW Cherry Ave
- 9800 SW Cypress St
- 5170 SW Chestnut Ave
- 9755 SW Cypress St
- 5260 SW Chestnut Ave
- 9725 SW Cypress St
- 9775 SW Cypress St
- 5150 SW Cherry Ave
- 9675 SW Cypress St
- 5175 SW Cherry Ave
- 9825 SW Cypress St
- 5195 SW Chestnut Ave
- 5100 SW Chestnut Ave
- 5225 SW Chestnut Ave