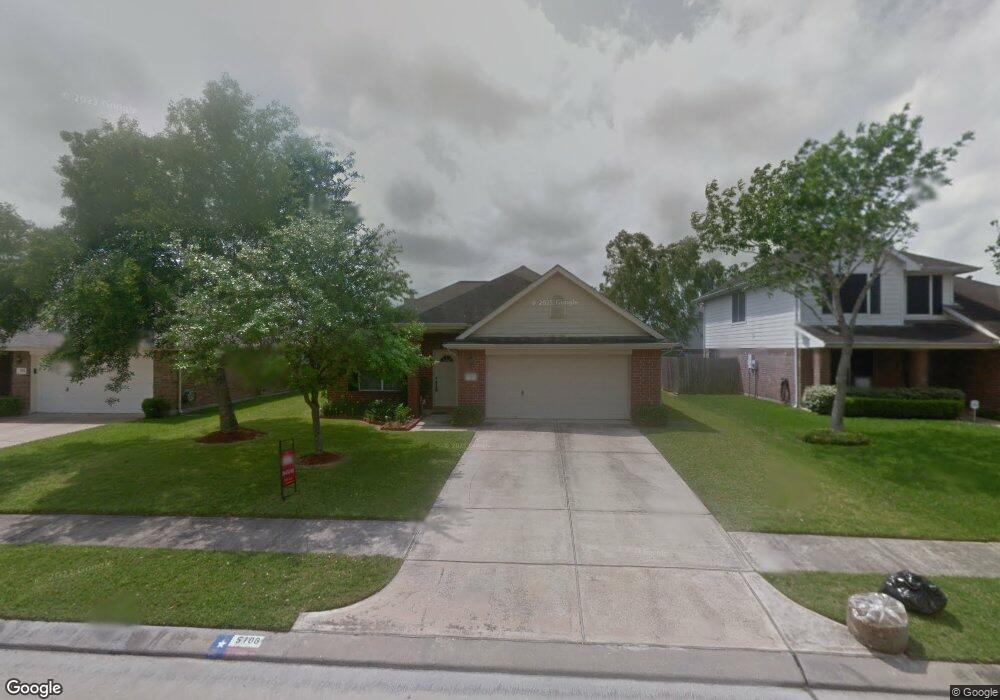
5106 Lockhart Dr Pearland, TX 77584
Estimated Value: $277,528 - $293,000
3
Beds
2
Baths
1,513
Sq Ft
$189/Sq Ft
Est. Value
About This Home
This home is located at 5106 Lockhart Dr, Pearland, TX 77584 and is currently estimated at $286,132, approximately $189 per square foot. 5106 Lockhart Dr is a home located in Brazoria County with nearby schools including Magnolia Elementary School, Pearland Junior High School South, and Sam Jamison Middle School.
Ownership History
Date
Name
Owned For
Owner Type
Purchase Details
Closed on
Aug 21, 2013
Sold by
Foxworth Patricia Gaye and Downey Amy Rashell
Bought by
Roach Kimberly D
Current Estimated Value
Home Financials for this Owner
Home Financials are based on the most recent Mortgage that was taken out on this home.
Original Mortgage
$124,208
Outstanding Balance
$92,773
Interest Rate
4.5%
Mortgage Type
FHA
Estimated Equity
$193,359
Purchase Details
Closed on
Mar 5, 2009
Sold by
Niemeyer Michael F
Bought by
Foxworth Patricia Gaye and Downey Amy Rashell
Home Financials for this Owner
Home Financials are based on the most recent Mortgage that was taken out on this home.
Original Mortgage
$136,403
Interest Rate
5.13%
Mortgage Type
FHA
Purchase Details
Closed on
Oct 15, 2008
Sold by
Niemeyer Michael F
Bought by
Niemeyer Michael F
Purchase Details
Closed on
Apr 11, 2001
Sold by
Lennar Homes Of Texas Inc
Bought by
Niemeyer Roger J
Home Financials for this Owner
Home Financials are based on the most recent Mortgage that was taken out on this home.
Original Mortgage
$55,050
Interest Rate
6.81%
Create a Home Valuation Report for This Property
The Home Valuation Report is an in-depth analysis detailing your home's value as well as a comparison with similar homes in the area
Home Values in the Area
Average Home Value in this Area
Purchase History
| Date | Buyer | Sale Price | Title Company |
|---|---|---|---|
| Roach Kimberly D | -- | Startex Title Company | |
| Foxworth Patricia Gaye | -- | Chicago Title | |
| Niemeyer Michael F | -- | None Available | |
| Niemeyer Roger J | -- | Regency Title Company |
Source: Public Records
Mortgage History
| Date | Status | Borrower | Loan Amount |
|---|---|---|---|
| Open | Roach Kimberly D | $124,208 | |
| Previous Owner | Foxworth Patricia Gaye | $136,403 | |
| Previous Owner | Niemeyer Roger J | $55,050 |
Source: Public Records
Tax History Compared to Growth
Tax History
| Year | Tax Paid | Tax Assessment Tax Assessment Total Assessment is a certain percentage of the fair market value that is determined by local assessors to be the total taxable value of land and additions on the property. | Land | Improvement |
|---|---|---|---|---|
| 2025 | $4,103 | $257,810 | $23,560 | $234,250 |
| 2023 | $4,103 | $228,162 | $22,870 | $249,140 |
| 2022 | $5,550 | $207,420 | $22,870 | $184,550 |
| 2021 | $5,549 | $192,240 | $22,870 | $169,370 |
| 2020 | $5,348 | $186,110 | $22,870 | $163,240 |
| 2019 | $4,879 | $159,510 | $22,870 | $136,640 |
| 2018 | $4,892 | $159,510 | $22,870 | $136,640 |
| 2017 | $4,945 | $159,510 | $22,870 | $136,640 |
| 2016 | $4,587 | $151,270 | $22,870 | $128,400 |
| 2014 | $3,764 | $126,970 | $22,870 | $104,100 |
Source: Public Records
Map
Nearby Homes
- 5101 Big Spring Dr
- 5205 Spring Branch Dr
- 16622 Mclean Rd
- 3911 Spring Garden Dr
- 4013 Ivywood Dr
- 16719 Mclean Rd
- 3910 Greenwood Dr
- 3834 Aubrell Rd
- 4015 Cedarwood Dr
- 3730 Aubrell Rd
- 3602 Lindhaven Dr
- 16708 N Wayne Ln
- 6436 Grace Ln
- 7206 Williams Rd
- 4806 Chaperel Dr
- 5806 Wilton St
- 3902 Basil Ct
- 3804 Parry Fields Ct
- 3806 Canterbury Park Dr
- 7223 Libby Ln
- 5104 Lockhart Dr
- 5108 Lockhart Dr
- 5105 Big Spring Dr
- 5102 Lockhart Dr
- 5103 Big Spring Dr
- 5110 Lockhart Dr
- 5107 Big Spring Dr
- 5105 Lockhart Dr
- 5109 Big Spring Dr
- 5107 Lockhart Dr
- 5103 Lockhart Dr
- 5012 Lockhart Dr
- 5112 Lockhart Dr
- 5101 Lockhart Dr
- 5109 Lockhart Dr
- 5013 Big Spring Dr
- 5111 Big Spring Dr
- 5013 Lockhart Dr
- 5111 Lockhart Dr
- 5010 Lockhart Dr