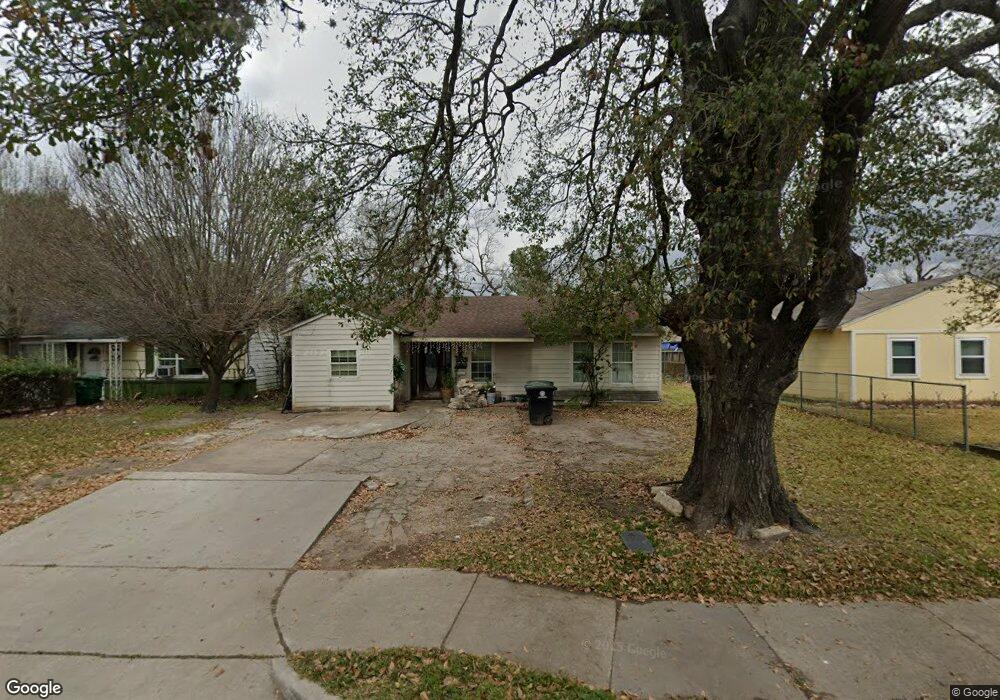
5107 Balkin St Houston, TX 77021
OST-South Union NeighborhoodEstimated Value: $196,002 - $234,000
3
Beds
2
Baths
1,678
Sq Ft
$126/Sq Ft
Est. Value
About This Home
This home is located at 5107 Balkin St, Houston, TX 77021 and is currently estimated at $211,251, approximately $125 per square foot. 5107 Balkin St is a home located in Harris County with nearby schools including Hartsfield Elementary Animal and Environmental Sciences Magnet, Cullen Middle School, and Yates High School.
Ownership History
Date
Name
Owned For
Owner Type
Purchase Details
Closed on
Jul 10, 2003
Sold by
First Capital Interest Llc
Bought by
Vasquez Edgar Roberto and Vasquez Alberto Salamon
Current Estimated Value
Home Financials for this Owner
Home Financials are based on the most recent Mortgage that was taken out on this home.
Original Mortgage
$50,500
Outstanding Balance
$21,422
Interest Rate
5.23%
Mortgage Type
Seller Take Back
Estimated Equity
$189,829
Purchase Details
Closed on
Oct 25, 1999
Sold by
First Capital Interest Llc
Bought by
German Richard
Home Financials for this Owner
Home Financials are based on the most recent Mortgage that was taken out on this home.
Original Mortgage
$38,000
Interest Rate
8.36%
Mortgage Type
Seller Take Back
Purchase Details
Closed on
May 12, 1998
Sold by
Hilal Danny
Bought by
First Capital Interest Llc
Purchase Details
Closed on
Dec 13, 1994
Sold by
Baker James
Bought by
Hilal Danny
Create a Home Valuation Report for This Property
The Home Valuation Report is an in-depth analysis detailing your home's value as well as a comparison with similar homes in the area
Home Values in the Area
Average Home Value in this Area
Purchase History
| Date | Buyer | Sale Price | Title Company |
|---|---|---|---|
| Vasquez Edgar Roberto | -- | -- | |
| German Richard | -- | -- | |
| First Capital Interest Llc | -- | -- | |
| Hilal Danny | -- | -- |
Source: Public Records
Mortgage History
| Date | Status | Borrower | Loan Amount |
|---|---|---|---|
| Open | Vasquez Edgar Roberto | $50,500 | |
| Previous Owner | German Richard | $38,000 |
Source: Public Records
Tax History Compared to Growth
Tax History
| Year | Tax Paid | Tax Assessment Tax Assessment Total Assessment is a certain percentage of the fair market value that is determined by local assessors to be the total taxable value of land and additions on the property. | Land | Improvement |
|---|---|---|---|---|
| 2025 | $1,012 | $137,463 | $81,185 | $56,278 |
| 2024 | $1,012 | $124,223 | $81,185 | $43,038 |
| 2023 | $1,012 | $124,280 | $81,185 | $43,095 |
| 2022 | $1,876 | $124,280 | $81,185 | $43,095 |
| 2021 | $1,805 | $109,319 | $49,960 | $59,359 |
| 2020 | $1,705 | $111,594 | $42,154 | $69,440 |
| 2019 | $1,620 | $86,276 | $32,786 | $53,490 |
| 2018 | $882 | $71,539 | $24,980 | $46,559 |
| 2017 | $1,337 | $54,893 | $18,735 | $36,158 |
| 2016 | $1,216 | $48,087 | $18,735 | $29,352 |
| 2015 | $663 | $45,052 | $18,735 | $26,317 |
| 2014 | $663 | $40,825 | $15,613 | $25,212 |
Source: Public Records
Map
Nearby Homes
- 5022 Balkin St
- 5107 Gren St
- 5111 Cosby St
- 5023 Cosby St
- 5210 Enyart St
- 5218 Kelso St
- 4927 Kelso St
- 5103 Yellowstone Blvd
- 5219 Cosby St
- 4611 Dewberry St
- 6527 Beekman Rd
- 4930 Gren St
- 5244 Enyart St
- 5035 Andrea St
- 5014 Yellowstone Blvd
- 6518 Weston St Unit 10
- 5224 Dewberry St
- 6421 Madrid St
- 6419 Madrid St
- 6417 Madrid St