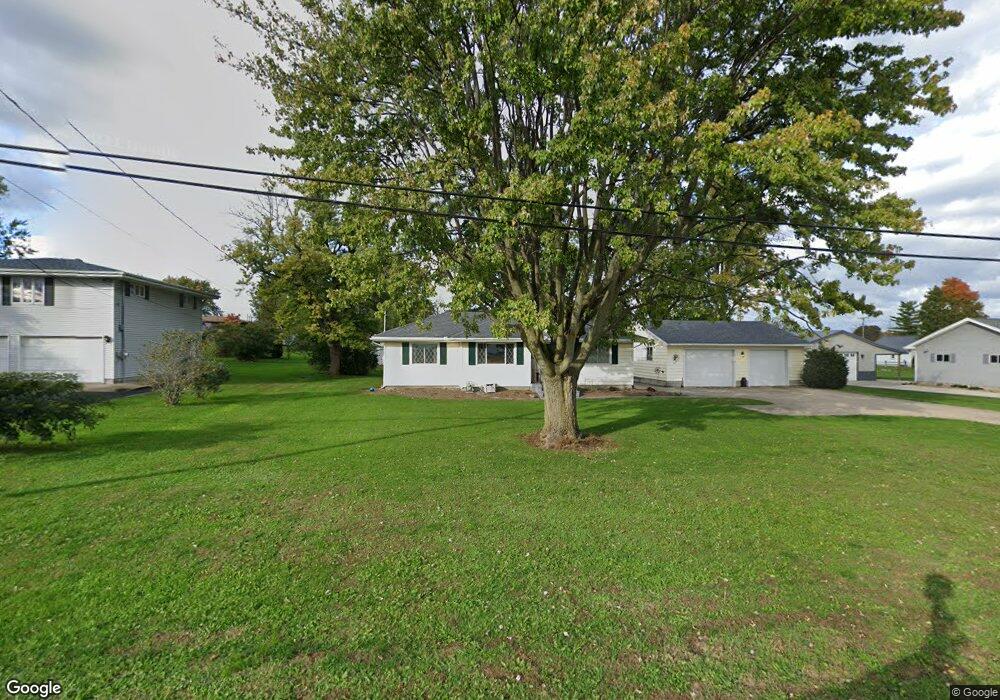
5107 Bogart Rd W Castalia, OH 44824
Estimated Value: $153,000 - $210,000
2
Beds
1
Bath
1,100
Sq Ft
$171/Sq Ft
Est. Value
About This Home
This home is located at 5107 Bogart Rd W, Castalia, OH 44824 and is currently estimated at $187,858, approximately $170 per square foot. 5107 Bogart Rd W is a home located in Erie County with nearby schools including Margaretta Elementary School, Margaretta High School, and Firelands Christian Academy.
Ownership History
Date
Name
Owned For
Owner Type
Purchase Details
Closed on
Jun 8, 2022
Sold by
Price Parker Jeffrey and Price Cynthia S
Bought by
Parker Jeffrey Price and Parker Cynthia S
Current Estimated Value
Purchase Details
Closed on
Mar 30, 2021
Sold by
Parker Freeh and Parker Cynthia S
Bought by
Parker Cynthia S and Parker Jeffrey Price
Home Financials for this Owner
Home Financials are based on the most recent Mortgage that was taken out on this home.
Original Mortgage
$77,000
Interest Rate
2.8%
Mortgage Type
New Conventional
Purchase Details
Closed on
Jul 23, 2009
Sold by
Bogoni Frank J and Bogoni Barbara L
Bought by
Freeh Cynthia S
Home Financials for this Owner
Home Financials are based on the most recent Mortgage that was taken out on this home.
Original Mortgage
$93,200
Interest Rate
5.62%
Mortgage Type
New Conventional
Create a Home Valuation Report for This Property
The Home Valuation Report is an in-depth analysis detailing your home's value as well as a comparison with similar homes in the area
Home Values in the Area
Average Home Value in this Area
Purchase History
| Date | Buyer | Sale Price | Title Company |
|---|---|---|---|
| Parker Jeffrey Price | -- | Leal Brandon J | |
| Parker Cynthia S | -- | None Listed On Document | |
| Freeh Cynthia S | $116,500 | Southern Title Of Ohio Ltd |
Source: Public Records
Mortgage History
| Date | Status | Borrower | Loan Amount |
|---|---|---|---|
| Previous Owner | Parker Cynthia S | $77,000 | |
| Previous Owner | Freeh Cynthia S | $93,200 |
Source: Public Records
Tax History Compared to Growth
Tax History
| Year | Tax Paid | Tax Assessment Tax Assessment Total Assessment is a certain percentage of the fair market value that is determined by local assessors to be the total taxable value of land and additions on the property. | Land | Improvement |
|---|---|---|---|---|
| 2024 | $1,673 | $44,386 | $12,890 | $31,496 |
| 2023 | $1,673 | $37,992 | $11,718 | $26,274 |
| 2022 | $1,638 | $37,992 | $11,718 | $26,274 |
| 2021 | $1,624 | $37,990 | $11,720 | $26,270 |
| 2020 | $1,582 | $34,900 | $11,720 | $23,180 |
| 2019 | $1,627 | $34,900 | $11,720 | $23,180 |
| 2018 | $1,711 | $34,900 | $11,720 | $23,180 |
| 2017 | $1,600 | $33,470 | $10,160 | $23,310 |
| 2016 | $1,583 | $33,470 | $10,160 | $23,310 |
| 2015 | $1,553 | $33,470 | $10,160 | $23,310 |
| 2014 | $1,600 | $33,470 | $10,160 | $23,310 |
| 2013 | $1,563 | $33,470 | $10,160 | $23,310 |
Source: Public Records
Map
Nearby Homes
- 3601 Bardshar Rd
- 3806 Ronald Dr
- 3005 Bardshar Rd
- 4117 Maple Ave
- 0 Lakeside Unit 20253835
- 0 Quarry Lakes Dr Unit 20205329
- 0 Quarry Lakes Dr Unit 20205328
- 5512 Billings Rd
- 735 Cedar Point
- 4514 Homegardner Rd
- 0 Vl Cold Creek Ct Unit 20232610
- 0 Vl Cold Creek Ct Unit 4477272
- 0 Northwest
- 402 Bardshar Rd
- VL Cold Creek Ct
- 6704 Parker Rd
- 6609 Ridgewood Dr
- 6606 Ridgewood Dr
- 7114 Hayes Ave
- 4406 Thorpe Dr
- 5109 Bogart Rd W
- 5105 Bogart Rd W
- 5112 Rockwood Dr
- 5108 Rockwood Dr
- 5120 Rockwood Dr
- 5203 Bogart Rd W
- 5202 Rockwood Dr
- 3615 Bardshar Rd
- 5101 Bogart Rd W
- 5101 Bogart Rd W
- 0 W Bogart Rd Unit 20223056
- 0 W Bogart Rd Unit 20223057
- 0 W Bogart Rd Unit 20205406
- 0 W Bogart Rd Unit 20223419
- 0 W Bogart Rd Unit 20223058
- 0 W Bogart Rd Unit 116662
- 0 W Bogart Rd Unit 112982
- 0 W Bogart Rd Unit 112980
- 0 W Bogart Rd Unit 506064
- 0 W Bogart Rd Unit 20194671