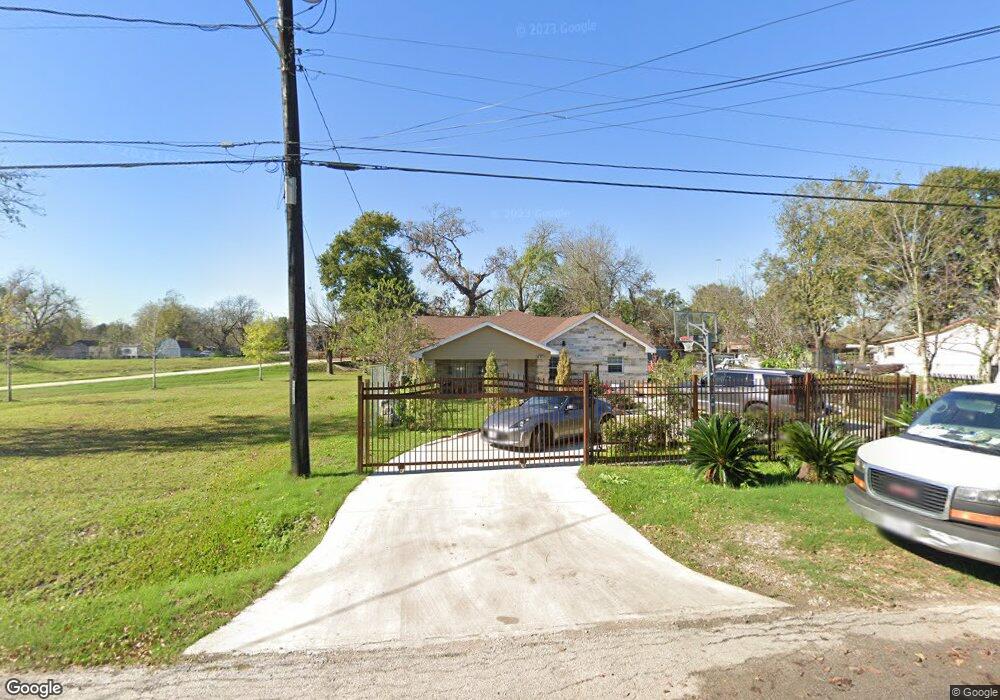
5107 Kashmere St Houston, TX 77026
Kashmere Gardens NeighborhoodEstimated Value: $193,000 - $270,000
3
Beds
1
Bath
1,576
Sq Ft
$154/Sq Ft
Est. Value
About This Home
This home is located at 5107 Kashmere St, Houston, TX 77026 and is currently estimated at $242,561, approximately $153 per square foot. 5107 Kashmere St is a home located in Harris County with nearby schools including Kashmere Gardens Elementary School, Key Middle, and Kashmere High School.
Ownership History
Date
Name
Owned For
Owner Type
Purchase Details
Closed on
Apr 15, 2019
Sold by
Freemont Capital Llc
Bought by
Espinoza Mondragon Eliseo
Current Estimated Value
Home Financials for this Owner
Home Financials are based on the most recent Mortgage that was taken out on this home.
Original Mortgage
$100,000
Interest Rate
4.1%
Mortgage Type
Purchase Money Mortgage
Purchase Details
Closed on
Dec 4, 2018
Sold by
Alarcon Linares Miguel and Alarcon Plazas Isabelina
Bought by
Freemont Capital Llc
Purchase Details
Closed on
May 29, 2018
Sold by
Freemont Capital Llc
Bought by
Linares Miguel and Plazas Isabelina Alarcon
Home Financials for this Owner
Home Financials are based on the most recent Mortgage that was taken out on this home.
Original Mortgage
$110,750
Interest Rate
4.5%
Mortgage Type
Purchase Money Mortgage
Purchase Details
Closed on
Sep 12, 2017
Sold by
Davis Bessie Carter
Bought by
Freemont Capital Llc
Create a Home Valuation Report for This Property
The Home Valuation Report is an in-depth analysis detailing your home's value as well as a comparison with similar homes in the area
Home Values in the Area
Average Home Value in this Area
Purchase History
| Date | Buyer | Sale Price | Title Company |
|---|---|---|---|
| Espinoza Mondragon Eliseo | -- | None Available | |
| Freemont Capital Llc | $57,900 | None Available | |
| Linares Miguel | -- | None Available | |
| Freemont Capital Llc | -- | None Available |
Source: Public Records
Mortgage History
| Date | Status | Borrower | Loan Amount |
|---|---|---|---|
| Previous Owner | Espinoza Mondragon Eliseo | $100,000 | |
| Previous Owner | Linares Miguel | $110,750 |
Source: Public Records
Tax History Compared to Growth
Tax History
| Year | Tax Paid | Tax Assessment Tax Assessment Total Assessment is a certain percentage of the fair market value that is determined by local assessors to be the total taxable value of land and additions on the property. | Land | Improvement |
|---|---|---|---|---|
| 2025 | $7,288 | $300,000 | $68,369 | $231,631 |
| 2024 | $7,288 | $348,310 | $68,369 | $279,941 |
| 2023 | $7,288 | $321,087 | $62,559 | $258,528 |
| 2022 | $5,381 | $244,395 | $44,685 | $199,710 |
| 2021 | $4,643 | $199,194 | $31,280 | $167,914 |
| 2020 | $2,004 | $82,769 | $31,280 | $51,489 |
| 2019 | $1,690 | $106,714 | $17,874 | $88,840 |
| 2018 | $2,350 | $92,877 | $17,874 | $75,003 |
| 2017 | $2,706 | $114,802 | $17,874 | $96,928 |
| 2016 | $2,460 | $112,095 | $13,406 | $98,689 |
| 2015 | -- | $88,450 | $8,937 | $79,513 |
| 2014 | -- | $88,450 | $8,937 | $79,513 |
Source: Public Records
Map
Nearby Homes
- 5305 Kashmere St
- 4921 Kashmere St
- 4921 Wipprecht St
- 0 Wipprecht St Unit 16984812
- 4819 Los Angeles St
- 4817 Los Angeles St
- 5806 Hirsch Rd
- 5618 Kashmere St
- 5013 Pardee St
- 0 0 Scenic Rd
- 4916 Lavender St
- 4810 Hirsch Rd
- 4918 Leffingwell St
- 4818 Lavender St
- 5217 Pickfair St
- 5210 Pickfair St
- 4211 Kashmere St
- 0 Kashmere St
- 5025 Falls St
- 5914 Wayne St
- 5111 Kashmere St
- 5115 Kashmere St
- 5109 Kashmere St
- 5102 Wayne St
- 5119 Kashmere St
- 5104 Kashmere St
- 5102 Kashmere St
- 5114 Wayne St
- 5205 Kashmere St
- 5110 Kashmere St
- 5114 Kashmere St
- 5110 Wayne St
- 5106 Kashmere St
- 5207 Kashmere St
- 4515 Pardee St
- 4533 Pardee St
- 5118 Kashmere St
- 5001 Kashmere St
- 5212 Wayne St
- 5010 Wayne St