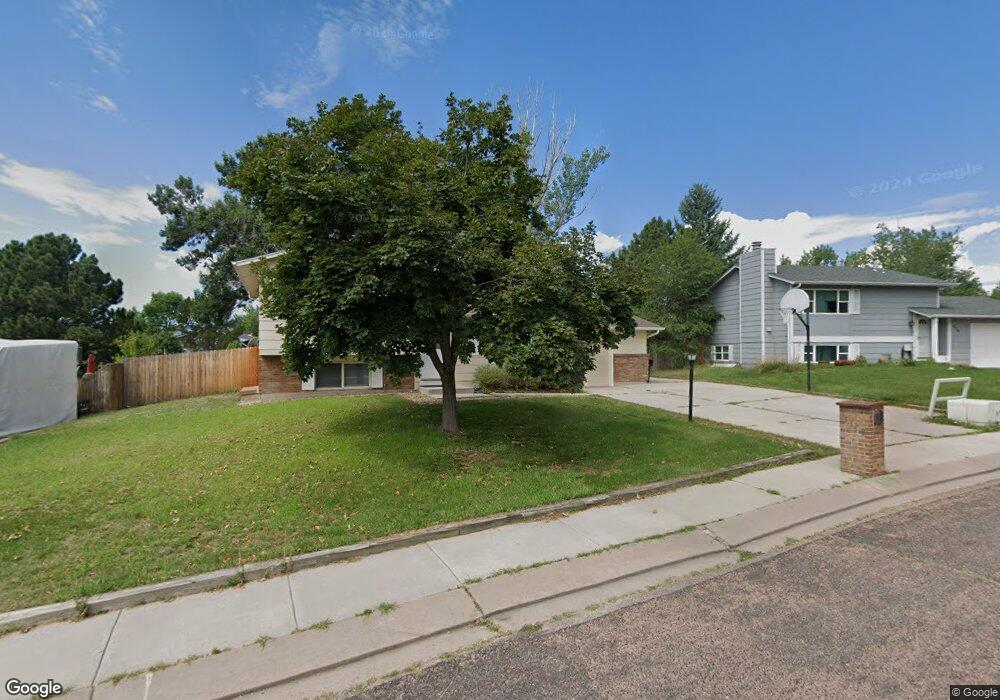
5108 Alturas Cir Colorado Springs, CO 80911
Security-Widefield NeighborhoodEstimated Value: $356,269 - $370,000
3
Beds
2
Baths
845
Sq Ft
$431/Sq Ft
Est. Value
About This Home
This home is located at 5108 Alturas Cir, Colorado Springs, CO 80911 and is currently estimated at $363,817, approximately $430 per square foot. 5108 Alturas Cir is a home located in El Paso County with nearby schools including French Elementary School, Sproul Junior High School, and Widefield High School.
Ownership History
Date
Name
Owned For
Owner Type
Purchase Details
Closed on
Mar 22, 2019
Sold by
Robledo Ronika R
Bought by
Montelongo Malia
Current Estimated Value
Home Financials for this Owner
Home Financials are based on the most recent Mortgage that was taken out on this home.
Original Mortgage
$235,653
Outstanding Balance
$210,590
Interest Rate
5.25%
Mortgage Type
FHA
Estimated Equity
$153,227
Purchase Details
Closed on
Feb 16, 2012
Sold by
Evans Ronika
Bought by
Robledo Ronika R
Purchase Details
Closed on
Jun 25, 2010
Sold by
Boyd James M and Boyd Linda K
Bought by
Evans Ronika
Home Financials for this Owner
Home Financials are based on the most recent Mortgage that was taken out on this home.
Original Mortgage
$153,122
Interest Rate
4.81%
Mortgage Type
VA
Purchase Details
Closed on
Aug 7, 1990
Bought by
Robledo Ronika R
Purchase Details
Closed on
May 1, 1983
Bought by
Robledo Ronika R
Create a Home Valuation Report for This Property
The Home Valuation Report is an in-depth analysis detailing your home's value as well as a comparison with similar homes in the area
Home Values in the Area
Average Home Value in this Area
Purchase History
| Date | Buyer | Sale Price | Title Company |
|---|---|---|---|
| Montelongo Malia | $240,000 | Heritage Title Co | |
| Robledo Ronika R | -- | None Available | |
| Evans Ronika | $149,900 | Stewart Title | |
| Robledo Ronika R | $60,500 | -- | |
| Robledo Ronika R | -- | -- |
Source: Public Records
Mortgage History
| Date | Status | Borrower | Loan Amount |
|---|---|---|---|
| Open | Montelongo Malia | $235,653 | |
| Previous Owner | Evans Ronika | $153,122 |
Source: Public Records
Tax History Compared to Growth
Tax History
| Year | Tax Paid | Tax Assessment Tax Assessment Total Assessment is a certain percentage of the fair market value that is determined by local assessors to be the total taxable value of land and additions on the property. | Land | Improvement |
|---|---|---|---|---|
| 2025 | $1,484 | $23,400 | -- | -- |
| 2024 | $1,423 | $23,750 | $4,020 | $19,730 |
| 2023 | $1,423 | $23,750 | $4,020 | $19,730 |
| 2022 | $1,275 | $17,080 | $2,780 | $14,300 |
| 2021 | $1,375 | $17,570 | $2,860 | $14,710 |
| 2020 | $1,102 | $13,680 | $2,500 | $11,180 |
| 2019 | $1,096 | $13,680 | $2,500 | $11,180 |
| 2018 | $956 | $11,140 | $1,870 | $9,270 |
| 2017 | $967 | $11,140 | $1,870 | $9,270 |
| 2016 | $812 | $11,430 | $1,990 | $9,440 |
| 2015 | $833 | $11,430 | $1,990 | $9,440 |
| 2014 | $830 | $11,430 | $1,790 | $9,640 |
Source: Public Records
Map
Nearby Homes
- 5070 Alturas Dr
- 5230 Quill Dr
- 5160 Quill Dr
- 5021 Bradley Cir
- 5230 Bradley Cir
- 4425 Windmill Creek Way
- 4401 Windmill Creek Way
- 4402 Windmill Creek Way
- 5317 Goodview Dr
- 4110 Novia Dr
- 4570 Windmill Creek Way
- 3905 Allgood Dr
- 4950 Elm Grove Dr
- 4722 Sebring Dr
- 4745 Heron Ct
- 4691 Pleasant Port View
- 1620 Widefield Dr
- 3640 Tail Wind Dr
- 3642 Red Baron Dr
- 5175 Almont Ave
- 5102 Alturas Cir
- 5114 Alturas Cir
- 5038 Durasno Dr
- 5034 Durasno Dr
- 5118 Alturas Cir
- 5125 Alturas Cir
- 5115 Alturas Cir
- 5105 Alturas Cir
- 4223 Sandberg Dr
- 5122 Alturas Cir
- 4219 Sandberg Dr
- 5090 Victory Rd
- 4215 Sandberg Dr
- 4227 Sandberg Dr
- 5110 Victory Rd
- 5080 Victory Rd
- 5135 Alturas Cir
- 4211 Sandberg Dr
- 5070 Victory Rd
- 5120 Victory Rd