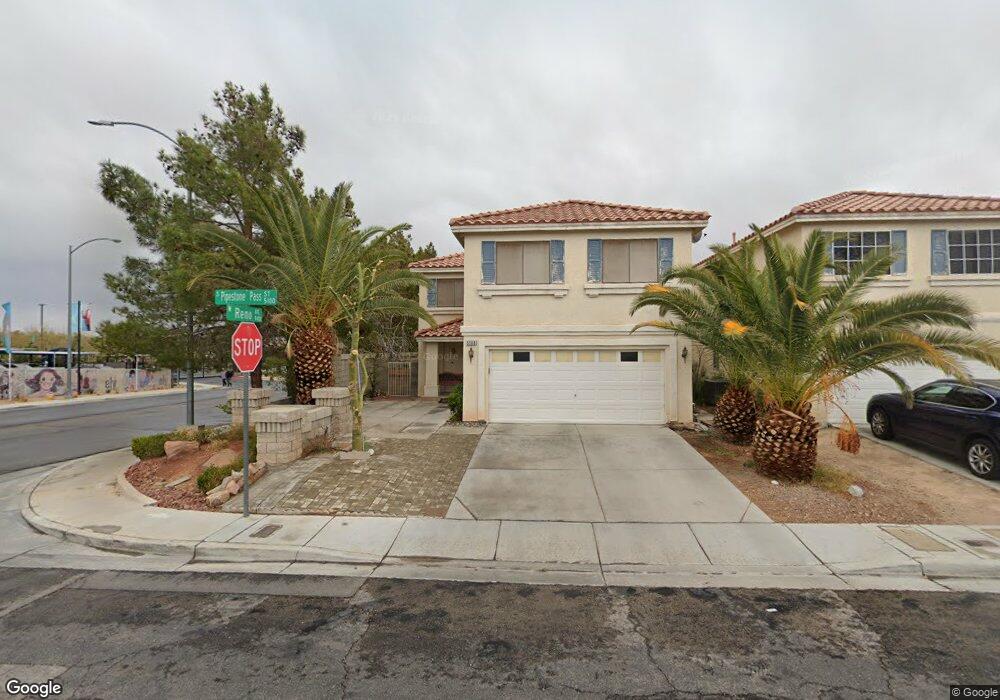
5108 Pipestone Pass St Las Vegas, NV 89148
Estimated Value: $464,000 - $533,000
4
Beds
3
Baths
2,232
Sq Ft
$223/Sq Ft
Est. Value
About This Home
This home is located at 5108 Pipestone Pass St, Las Vegas, NV 89148 and is currently estimated at $498,176, approximately $223 per square foot. 5108 Pipestone Pass St is a home located in Clark County with nearby schools including Sandra B Abston Elementary School, Victoria Fertitta Middle School, and Durango High School.
Ownership History
Date
Name
Owned For
Owner Type
Purchase Details
Closed on
Apr 13, 2015
Sold by
Pham Jimmy
Bought by
Pham Lynni Nicole
Current Estimated Value
Home Financials for this Owner
Home Financials are based on the most recent Mortgage that was taken out on this home.
Original Mortgage
$150,000
Interest Rate
3.64%
Mortgage Type
New Conventional
Purchase Details
Closed on
Oct 15, 2004
Sold by
Trinh John D
Bought by
Pham Jimmy
Home Financials for this Owner
Home Financials are based on the most recent Mortgage that was taken out on this home.
Original Mortgage
$151,600
Interest Rate
5.69%
Mortgage Type
Unknown
Purchase Details
Closed on
Oct 9, 2002
Sold by
American West Homes Inc
Bought by
Trinh John D
Home Financials for this Owner
Home Financials are based on the most recent Mortgage that was taken out on this home.
Original Mortgage
$151,600
Interest Rate
5.99%
Create a Home Valuation Report for This Property
The Home Valuation Report is an in-depth analysis detailing your home's value as well as a comparison with similar homes in the area
Home Values in the Area
Average Home Value in this Area
Purchase History
| Date | Buyer | Sale Price | Title Company |
|---|---|---|---|
| Pham Lynni Nicole | $215,000 | First American Title Paseo | |
| Pham Jimmy | $189,950 | Fidelity National Title | |
| Trinh John D | $189,500 | First American Title Co |
Source: Public Records
Mortgage History
| Date | Status | Borrower | Loan Amount |
|---|---|---|---|
| Previous Owner | Pham Lynni Nicole | $150,000 | |
| Previous Owner | Pham Jimmy | $151,600 | |
| Previous Owner | Trinh John D | $151,600 |
Source: Public Records
Tax History Compared to Growth
Tax History
| Year | Tax Paid | Tax Assessment Tax Assessment Total Assessment is a certain percentage of the fair market value that is determined by local assessors to be the total taxable value of land and additions on the property. | Land | Improvement |
|---|---|---|---|---|
| 2025 | $2,619 | $125,338 | $42,700 | $82,638 |
| 2024 | $2,425 | $125,338 | $42,700 | $82,638 |
| 2023 | $1,634 | $115,477 | $37,450 | $78,027 |
| 2022 | $2,246 | $103,087 | $31,850 | $71,237 |
| 2021 | $2,080 | $95,958 | $28,350 | $67,608 |
| 2020 | $1,928 | $92,539 | $25,550 | $66,989 |
| 2019 | $1,807 | $89,367 | $23,450 | $65,917 |
| 2018 | $1,725 | $83,949 | $21,000 | $62,949 |
| 2017 | $2,411 | $82,219 | $18,550 | $63,669 |
| 2016 | $1,634 | $75,602 | $14,000 | $61,602 |
| 2015 | $1,630 | $73,060 | $10,500 | $62,560 |
| 2014 | $1,579 | $52,241 | $8,400 | $43,841 |
Source: Public Records
Map
Nearby Homes
- 9522 Arrowhead Falls Ct
- 9580 W Reno Ave Unit 261
- 9580 W Reno Ave Unit 240
- 9580 W Reno Ave Unit 233
- 9580 W Reno Ave Unit 238
- 5048 Orchid Springs St
- 9693 Bighorn Island Ave
- 9731 Cathedral Stairs Ct
- 9631 Tuscola Ct
- 5076 Thunder River Cir
- 5014 Thunder River Cir
- 5077 Thunder River Cir
- 9687 Ridgebluff Ave
- 5015 Thunder River Cir
- 9821 Sedona Shrine Ave
- 9472 W Diablo Dr
- 9699 Villa Lorena Ave
- 9217 Valley Betica Ave
- 9748 Villa Lorena Ave
- 9205 Valley Betica Ave
- 5114 Pipestone Pass St
- 5120 Pipestone Pass St
- 5126 Pipestone Pass St
- 9480 Encanto Cavern Ct
- 5132 Pipestone Pass St
- 9486 Encanto Cavern Ct
- 5138 Pipestone Pass St
- 9492 Encanto Cavern Ct
- 9492 Encanto Cavern Ct
- 9492 Encanto Cavern Ct
- 9479 Encanto Cavern Ct
- 5144 Pipestone Pass St
- 9485 Encanto Cavern Ct
- 9498 Encanto Cavern Ct
- 9491 Encanto Cavern Ct
- 5150 Pipestone Pass St
- 9497 Encanto Cavern Ct
- 9478 Lenox Crater Ct
- 9506 Adobe Arch Ct
- 5156 Pipestone Pass St