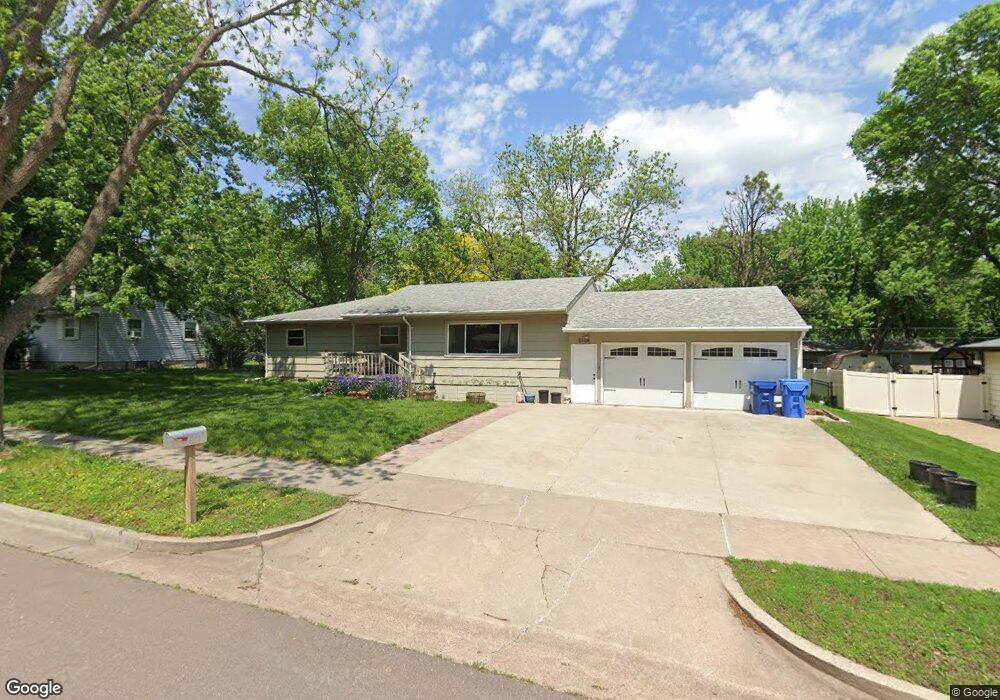
5108 W 38th St Sioux Falls, SD 57106
Estimated Value: $309,000 - $538,000
4
Beds
2
Baths
2,846
Sq Ft
$136/Sq Ft
Est. Value
About This Home
This home is located at 5108 W 38th St, Sioux Falls, SD 57106 and is currently estimated at $386,608, approximately $135 per square foot. 5108 W 38th St is a home located in Minnehaha County with nearby schools including Oscar Howe Elementary School, Memorial Middle School, and Roosevelt High School.
Ownership History
Date
Name
Owned For
Owner Type
Purchase Details
Closed on
Jun 22, 2018
Sold by
Sik Derek R and Sik Sarah E
Bought by
Stout Jolene L
Current Estimated Value
Purchase Details
Closed on
Apr 10, 2014
Sold by
Anna K Anna K
Bought by
Sik Derek R and Sik Sarah E
Home Financials for this Owner
Home Financials are based on the most recent Mortgage that was taken out on this home.
Original Mortgage
$157,600
Interest Rate
4.41%
Mortgage Type
Stand Alone First
Purchase Details
Closed on
Sep 28, 2012
Sold by
Edward L Edward L and Mcguire Jane A
Bought by
Oestreich Anna K
Purchase Details
Closed on
Jun 12, 2012
Sold by
Joel C Joel C
Bought by
Mcquire Edward L and Mcquire Jane A
Purchase Details
Closed on
Jun 7, 2012
Sold by
Daniel M Daniel M
Bought by
Mcguire Edward L and Mcguire Jane A
Purchase Details
Closed on
Jun 6, 2012
Sold by
Lisa Lisa
Bought by
Mcquire Edward L and Mcquire Jane A
Create a Home Valuation Report for This Property
The Home Valuation Report is an in-depth analysis detailing your home's value as well as a comparison with similar homes in the area
Home Values in the Area
Average Home Value in this Area
Purchase History
| Date | Buyer | Sale Price | Title Company |
|---|---|---|---|
| Stout Jolene L | $208,000 | Stewart Title Co | |
| Sik Derek R | $167,500 | Dataquick Title Llc | |
| Oestreich Anna K | $110,500 | -- | |
| Mcquire Edward L | -- | -- | |
| Mcquire Edward L | -- | -- | |
| Mcguire Edward L | -- | -- | |
| Mcguire Edward L | -- | -- | |
| Mcquire Edward L | -- | -- |
Source: Public Records
Mortgage History
| Date | Status | Borrower | Loan Amount |
|---|---|---|---|
| Previous Owner | Sik Derek R | $157,600 |
Source: Public Records
Tax History Compared to Growth
Tax History
| Year | Tax Paid | Tax Assessment Tax Assessment Total Assessment is a certain percentage of the fair market value that is determined by local assessors to be the total taxable value of land and additions on the property. | Land | Improvement |
|---|---|---|---|---|
| 2024 | $4,183 | $303,600 | $31,500 | $272,100 |
| 2023 | $4,126 | $288,400 | $31,500 | $256,900 |
| 2022 | $4,908 | $326,600 | $31,500 | $295,100 |
| 2021 | $2,863 | $240,600 | $0 | $0 |
| 2020 | $2,863 | $178,100 | $0 | $0 |
| 2019 | $2,962 | $181,667 | $0 | $0 |
| 2018 | $2,806 | $176,678 | $0 | $0 |
| 2017 | $2,520 | $172,936 | $33,250 | $139,686 |
| 2016 | $2,520 | $154,567 | $33,250 | $121,317 |
| 2015 | $2,486 | $146,630 | $33,250 | $113,380 |
| 2014 | -- | $139,640 | $33,250 | $106,390 |
Source: Public Records
Map
Nearby Homes
- 5113 W 40th St
- 4900 W 38th St
- 2722 S Oriya Place
- 3205 S Terry Ave
- 2800 S Oriya Place
- 2807 S Terry Ave
- 2803 S Terry Ave
- 4800 W 38th St
- 4709 W 38th St
- 4705 W 38th St
- 5301 W 32nd St
- 3604 S Gateway Blvd Unit 204
- 5705 W 43rd St
- 3600 S Gateway Blvd Unit 104
- 3600 S Gateway Blvd Unit 201
- 3708 S Terry Ave Unit 303
- 3556 S Gateway Blvd Unit 203
- 3712 S Terry Ave Unit 201
- 5813 W 36th St
- 3608 S Gateway Blvd Unit 304