5109 42nd St Lubbock, TX 79414
Stubbs-Stewart NeighborhoodEstimated Value: $120,000 - $143,000
3
Beds
2
Baths
969
Sq Ft
$138/Sq Ft
Est. Value
About This Home
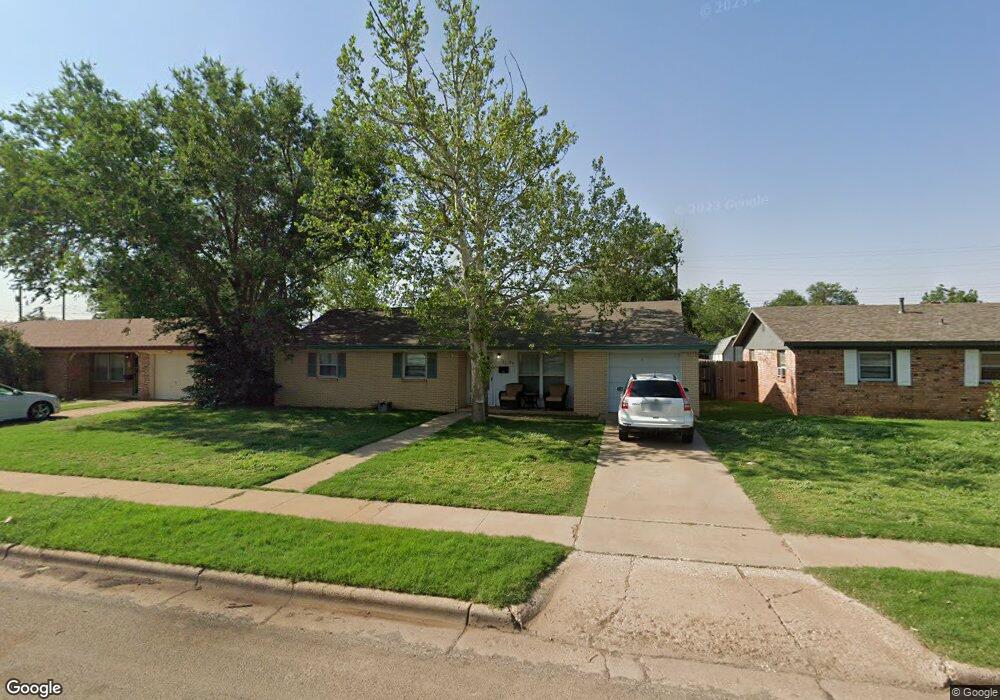
This home is located at 5109 42nd St, Lubbock, TX 79414 and is currently estimated at $133,264, approximately $137 per square foot. 5109 42nd St is a home located in Lubbock County with nearby schools including Stewart Elementary School, Commander William C. McCool Academy, and Irons Middle School.
Ownership History
Date
Name
Owned For
Owner Type
Purchase Details
Closed on
Jan 8, 2018
Sold by
Clouse Jimmy W and Clouse Deborah M
Bought by
Joiner Properties Llc
Current Estimated Value
Purchase Details
Closed on
May 11, 2004
Sold by
Holly Landon
Bought by
Clouse Jimmy W and Clouse Deborah M
Purchase Details
Closed on
Oct 22, 1993
Sold by
Driskill Jack P
Bought by
Clouse Jimmy W and Clouse Deborah M
Purchase Details
Closed on
Dec 13, 1991
Sold by
Hallgarth David
Bought by
Clouse Jimmy W and Clouse Deborah M
Create a Home Valuation Report for This Property
The Home Valuation Report is an in-depth analysis detailing your home's value as well as a comparison with similar homes in the area
Home Values in the Area
Average Home Value in this Area
Purchase History
| Date | Buyer | Sale Price | Title Company |
|---|---|---|---|
| Joiner Properties Llc | -- | None Available | |
| Clouse Jimmy W | -- | -- | |
| Clouse Jimmy W | -- | -- | |
| Clouse Jimmy W | -- | -- |
Source: Public Records
Tax History Compared to Growth
Tax History
| Year | Tax Paid | Tax Assessment Tax Assessment Total Assessment is a certain percentage of the fair market value that is determined by local assessors to be the total taxable value of land and additions on the property. | Land | Improvement |
|---|---|---|---|---|
| 2025 | $2,043 | $82,503 | $23,000 | $59,503 |
| 2024 | $2,043 | $120,339 | $10,890 | $109,449 |
| 2023 | $2,067 | $111,218 | $10,890 | $100,328 |
| 2022 | $2,227 | $110,002 | $10,890 | $99,112 |
| 2021 | $2,056 | $96,017 | $10,890 | $85,127 |
| 2020 | $1,968 | $90,489 | $10,890 | $79,599 |
| 2019 | $1,858 | $82,750 | $10,890 | $71,860 |
| 2018 | $1,798 | $79,987 | $10,890 | $69,097 |
| 2017 | $1,651 | $73,353 | $10,890 | $62,463 |
| 2016 | $1,651 | $73,353 | $10,890 | $62,463 |
| 2015 | $1,468 | $67,072 | $10,890 | $56,182 |
| 2014 | $1,468 | $65,998 | $4,950 | $61,048 |
Source: Public Records
Map
Nearby Homes