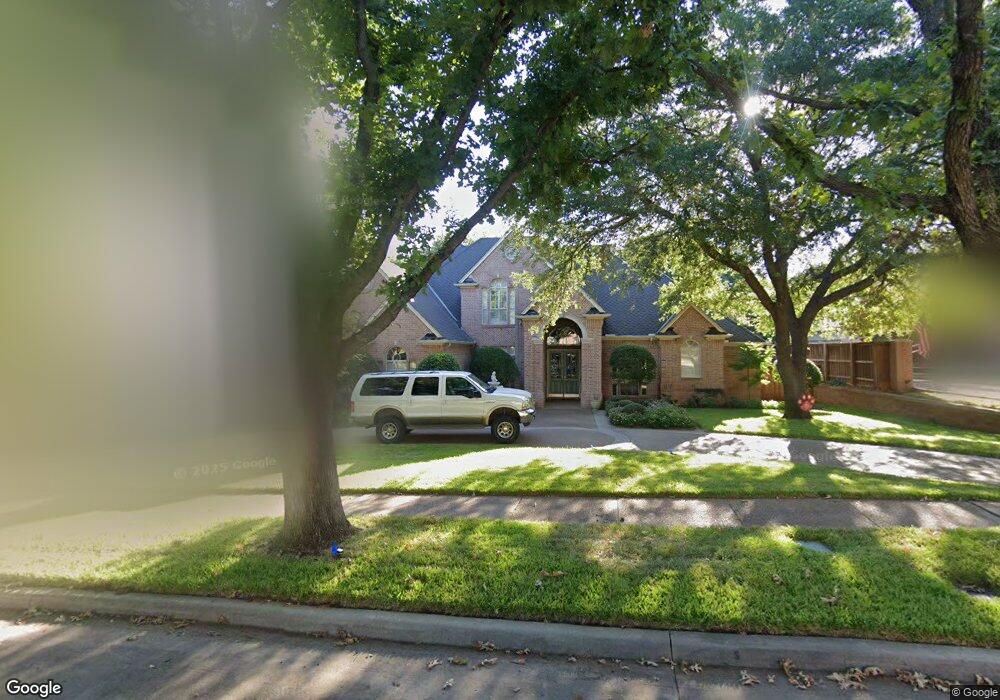
5109 Overhill Dr Colleyville, TX 76034
Estimated Value: $1,068,000 - $1,135,000
4
Beds
5
Baths
3,817
Sq Ft
$290/Sq Ft
Est. Value
About This Home
This home is located at 5109 Overhill Dr, Colleyville, TX 76034 and is currently estimated at $1,106,071, approximately $289 per square foot. 5109 Overhill Dr is a home located in Tarrant County with nearby schools including O.C. Taylor Elementary School, Colleyville Middle School, and Holy Trinity Catholic School.
Ownership History
Date
Name
Owned For
Owner Type
Purchase Details
Closed on
Aug 7, 2017
Sold by
Mays Charles R and Mays Charlie R
Bought by
Allen Rory L and French Allen Ashley
Current Estimated Value
Home Financials for this Owner
Home Financials are based on the most recent Mortgage that was taken out on this home.
Original Mortgage
$580,000
Outstanding Balance
$483,180
Interest Rate
3.9%
Mortgage Type
New Conventional
Estimated Equity
$622,891
Purchase Details
Closed on
Jun 27, 2016
Sold by
Mays Stephanie H
Bought by
Mays Charlie R
Home Financials for this Owner
Home Financials are based on the most recent Mortgage that was taken out on this home.
Original Mortgage
$373,100
Interest Rate
3.58%
Mortgage Type
Purchase Money Mortgage
Purchase Details
Closed on
Apr 13, 2000
Sold by
Karing Michael and Wood Beverly G
Bought by
Mays Charles R and Mays Stephanie H
Purchase Details
Closed on
Jun 20, 1995
Sold by
Connolly Kenneth M and Connolly Barbara D
Bought by
Karing Michael and Wood Beverly G
Create a Home Valuation Report for This Property
The Home Valuation Report is an in-depth analysis detailing your home's value as well as a comparison with similar homes in the area
Home Values in the Area
Average Home Value in this Area
Purchase History
| Date | Buyer | Sale Price | Title Company |
|---|---|---|---|
| Allen Rory L | -- | Capital Title | |
| Mays Charlie R | -- | None Available | |
| Mays Charles R | -- | First American Title Co | |
| Karing Michael | -- | Safeco Land Title |
Source: Public Records
Mortgage History
| Date | Status | Borrower | Loan Amount |
|---|---|---|---|
| Open | Allen Rory L | $580,000 | |
| Previous Owner | Mays Charlie R | $373,100 |
Source: Public Records
Tax History Compared to Growth
Tax History
| Year | Tax Paid | Tax Assessment Tax Assessment Total Assessment is a certain percentage of the fair market value that is determined by local assessors to be the total taxable value of land and additions on the property. | Land | Improvement |
|---|---|---|---|---|
| 2025 | $3,191 | $1,008,753 | $235,450 | $773,303 |
| 2024 | $3,191 | $1,008,753 | $235,450 | $773,303 |
| 2023 | $12,017 | $824,373 | $235,450 | $588,923 |
| 2022 | $12,790 | $647,611 | $235,450 | $412,161 |
| 2021 | $14,222 | $647,611 | $141,270 | $506,341 |
| 2020 | $13,322 | $599,527 | $141,270 | $458,257 |
| 2019 | $14,691 | $635,407 | $175,000 | $460,407 |
| 2018 | $3,531 | $593,982 | $140,000 | $453,982 |
| 2017 | $13,443 | $569,044 | $140,000 | $429,044 |
| 2016 | $13,333 | $564,389 | $140,000 | $424,389 |
| 2015 | $12,337 | $540,900 | $100,000 | $440,900 |
| 2014 | $12,337 | $540,900 | $100,000 | $440,900 |
Source: Public Records
Map
Nearby Homes
- 2906 Edgewood Ln
- 4282 Hearthside Dr
- 2906 Cottonwood Ln
- 4214 Hearthside Dr
- 4213 Hearthside Dr
- 3321 Circlewood Ct
- 3278 Birch Ave
- 3301 Queensbury Way W
- 3329 Moss Creek Dr
- 3409 Crossgate Cir N
- 5134 Post Oak Trail
- 3701 Post Oak Trail
- 3712 Bur Oak Dr
- 3705 Rothschild Blvd
- 3712 Rothschild Blvd
- 3110 Fox Run Dr
- 3908 Heritage Oaks Dr
- 4728 Cabernet Cir
- 4300 Eaton Cir
- 3933 Blackjack Oak Dr
- 5107 Overhill Dr
- 5201 Overhill Dr
- 3009 Edgewood Ln
- 5108 Old Oak Ln
- 5106 Old Oak Ln
- 5105 Overhill Dr
- 5110 Old Oak Ln
- 5200 Overhill Dr
- 5108 Overhill Dr
- 5104 Old Oak Ln
- 5106 Overhill Dr
- 5103 Overhill Dr
- 3001 Edgewood Ln
- 5104 Overhill Dr
- 5102 Old Oak Ln
- 3008 Edgewood Ln
- 5107 Old Oak Ln
- 3004 Edgewood Ln
- 3100 Edgewood Ln
- 5105 Old Oak Ln