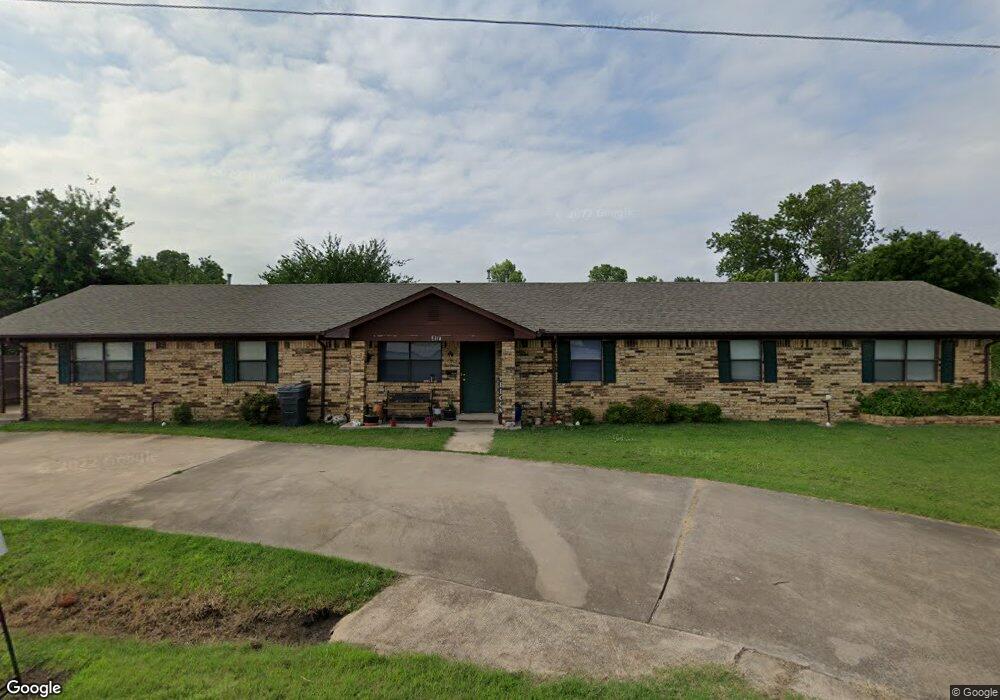
511 6th Ave SW Ardmore, OK 73401
Estimated Value: $180,000 - $323,000
3
Beds
3
Baths
2,606
Sq Ft
$90/Sq Ft
Est. Value
About This Home
This home is located at 511 6th Ave SW, Ardmore, OK 73401 and is currently estimated at $235,695, approximately $90 per square foot. 511 6th Ave SW is a home located in Carter County with nearby schools including Lincoln Elementary School, Ardmore Middle School, and Ardmore High School.
Ownership History
Date
Name
Owned For
Owner Type
Purchase Details
Closed on
Jan 31, 2019
Sold by
Kenaga Julie Z and Kenaga Phillip M
Bought by
Iron Throne Investments Llc
Current Estimated Value
Home Financials for this Owner
Home Financials are based on the most recent Mortgage that was taken out on this home.
Original Mortgage
$164,500
Outstanding Balance
$144,917
Interest Rate
4.6%
Mortgage Type
Unknown
Estimated Equity
$90,778
Purchase Details
Closed on
Aug 31, 2005
Sold by
Kenaga Julie Zumwalt
Bought by
Kenaga Julie Z
Purchase Details
Closed on
Jun 16, 2003
Sold by
Carter Co Assoc Of Retare
Bought by
Imel Julie Zumwalt
Purchase Details
Closed on
Oct 8, 1999
Sold by
Nettleton Victor A
Bought by
Carter Co Assoc
Purchase Details
Closed on
Dec 17, 1997
Sold by
Holt Madge Musgraves
Bought by
Holt Madge M
Create a Home Valuation Report for This Property
The Home Valuation Report is an in-depth analysis detailing your home's value as well as a comparison with similar homes in the area
Home Values in the Area
Average Home Value in this Area
Purchase History
| Date | Buyer | Sale Price | Title Company |
|---|---|---|---|
| Iron Throne Investments Llc | $164,500 | Stewart Title Of Oklahoma In | |
| Kenaga Julie Z | -- | -- | |
| Imel Julie Zumwalt | $87,000 | -- | |
| Carter Co Assoc | $87,000 | -- | |
| Holt Madge M | -- | -- |
Source: Public Records
Mortgage History
| Date | Status | Borrower | Loan Amount |
|---|---|---|---|
| Open | Iron Throne Investments Llc | $164,500 |
Source: Public Records
Tax History Compared to Growth
Tax History
| Year | Tax Paid | Tax Assessment Tax Assessment Total Assessment is a certain percentage of the fair market value that is determined by local assessors to be the total taxable value of land and additions on the property. | Land | Improvement |
|---|---|---|---|---|
| 2024 | $2,258 | $22,852 | $3,693 | $19,159 |
| 2023 | $2,150 | $21,763 | $3,565 | $18,198 |
| 2022 | $1,982 | $20,727 | $3,358 | $17,369 |
| 2021 | $1,992 | $19,740 | $2,970 | $16,770 |
| 2020 | $1,963 | $19,740 | $2,970 | $16,770 |
| 2019 | $1,158 | $11,928 | $1,834 | $10,094 |
| 2018 | $1,121 | $11,360 | $1,741 | $9,619 |
| 2017 | $989 | $10,819 | $1,622 | $9,197 |
| 2016 | $960 | $10,304 | $1,502 | $8,802 |
| 2015 | $754 | $9,814 | $308 | $9,506 |
| 2014 | $718 | $9,346 | $273 | $9,073 |
Source: Public Records
Map
Nearby Homes