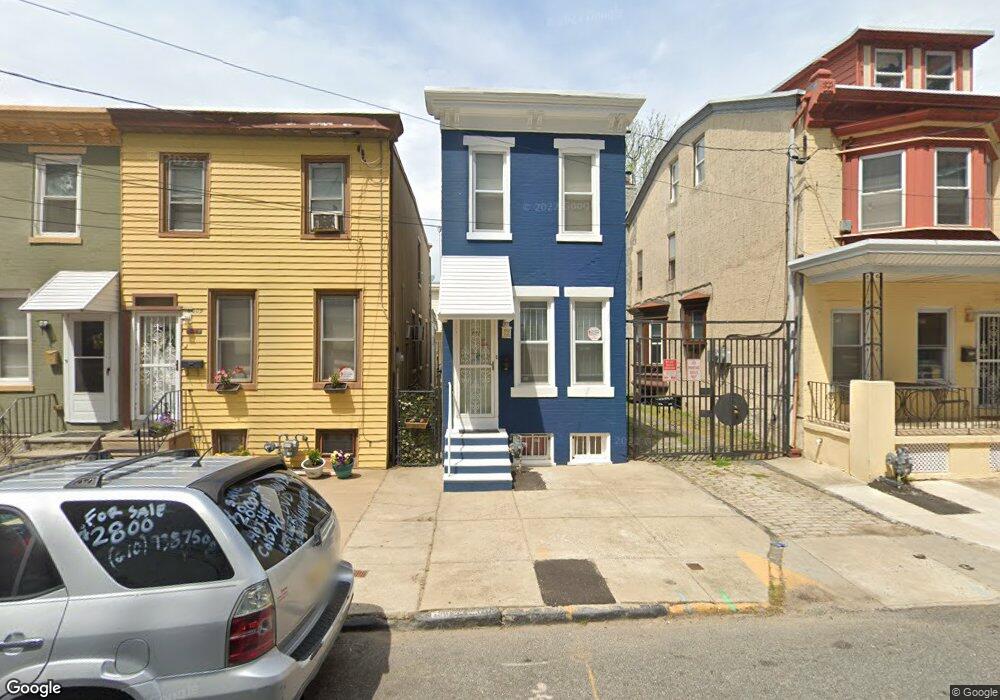
511 Benson St Camden, NJ 08103
Lanning Square NeighborhoodEstimated Value: $115,791 - $227,000
--
Bed
--
Bath
924
Sq Ft
$197/Sq Ft
Est. Value
About This Home
This home is located at 511 Benson St, Camden, NJ 08103 and is currently estimated at $181,948, approximately $196 per square foot. 511 Benson St is a home located in Camden County with nearby schools including Camden High School, Leap Academy University Charter School, and Hope Community Charter School.
Ownership History
Date
Name
Owned For
Owner Type
Purchase Details
Closed on
Sep 22, 2025
Sold by
Morales Maricsa
Bought by
Rowan University/Rutgers Camden Board Of Gove
Current Estimated Value
Purchase Details
Closed on
Jun 21, 2019
Sold by
Morales Henry and Rodriguez Morales Sonia
Bought by
Delaware River Investments Llc
Purchase Details
Closed on
Mar 25, 1996
Sold by
Guzman Arimitivo
Bought by
Morales Maricsa
Home Financials for this Owner
Home Financials are based on the most recent Mortgage that was taken out on this home.
Original Mortgage
$33,000
Interest Rate
7.34%
Mortgage Type
Purchase Money Mortgage
Create a Home Valuation Report for This Property
The Home Valuation Report is an in-depth analysis detailing your home's value as well as a comparison with similar homes in the area
Home Values in the Area
Average Home Value in this Area
Purchase History
| Date | Buyer | Sale Price | Title Company |
|---|---|---|---|
| Rowan University/Rutgers Camden Board Of Gove | $220,000 | Acw Abstract | |
| Delaware River Investments Llc | $78,000 | None Available | |
| Morales Maricsa | $35,000 | -- |
Source: Public Records
Mortgage History
| Date | Status | Borrower | Loan Amount |
|---|---|---|---|
| Previous Owner | Morales Maricsa | $33,000 |
Source: Public Records
Tax History Compared to Growth
Tax History
| Year | Tax Paid | Tax Assessment Tax Assessment Total Assessment is a certain percentage of the fair market value that is determined by local assessors to be the total taxable value of land and additions on the property. | Land | Improvement |
|---|---|---|---|---|
| 2025 | $2,374 | $67,000 | $34,700 | $32,300 |
| 2024 | $2,295 | $67,000 | $34,700 | $32,300 |
| 2023 | $2,295 | $67,000 | $34,700 | $32,300 |
| 2022 | $2,252 | $67,000 | $34,700 | $32,300 |
| 2021 | $2,244 | $67,000 | $34,700 | $32,300 |
| 2020 | $2,131 | $67,000 | $34,700 | $32,300 |
| 2019 | $2,040 | $67,000 | $34,700 | $32,300 |
| 2018 | $2,029 | $67,000 | $34,700 | $32,300 |
| 2017 | $1,980 | $67,000 | $34,700 | $32,300 |
| 2016 | $1,917 | $67,000 | $34,700 | $32,300 |
| 2015 | $1,845 | $67,000 | $34,700 | $32,300 |
| 2014 | $1,801 | $67,000 | $34,700 | $32,300 |
Source: Public Records
Map
Nearby Homes