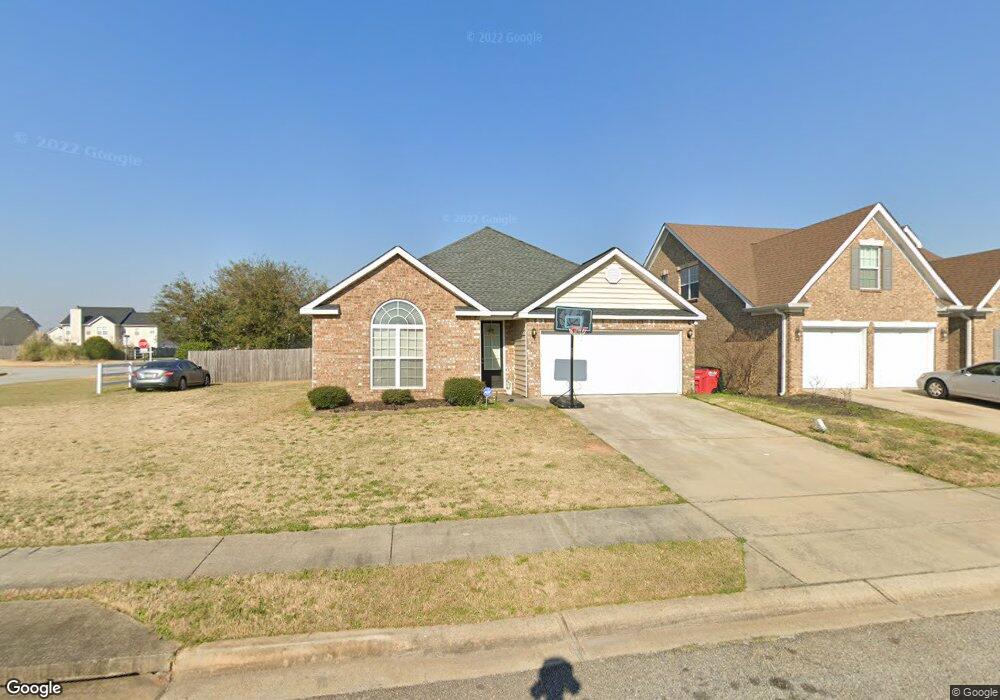
511 Bob White Rd Unit N/A Macon, GA 31216
Estimated Value: $206,818 - $235,000
3
Beds
2
Baths
1,437
Sq Ft
$157/Sq Ft
Est. Value
About This Home
This home is located at 511 Bob White Rd Unit N/A, Macon, GA 31216 and is currently estimated at $226,205, approximately $157 per square foot. 511 Bob White Rd Unit N/A is a home located in Bibb County with nearby schools including Heard Elementary School, Rutland Middle School, and Rutland High School.
Ownership History
Date
Name
Owned For
Owner Type
Purchase Details
Closed on
Oct 11, 2016
Sold by
James L
Bought by
Threatt Lakendra C
Current Estimated Value
Home Financials for this Owner
Home Financials are based on the most recent Mortgage that was taken out on this home.
Original Mortgage
$115,862
Outstanding Balance
$92,504
Interest Rate
3.5%
Mortgage Type
FHA
Estimated Equity
$133,701
Purchase Details
Closed on
Jul 3, 2012
Sold by
Project Development & Management Llc
Bought by
Williams James L and Williams Starmisha D
Home Financials for this Owner
Home Financials are based on the most recent Mortgage that was taken out on this home.
Original Mortgage
$116,860
Interest Rate
3.75%
Mortgage Type
FHA
Purchase Details
Closed on
Feb 9, 2011
Sold by
Bibb 185 Lllp
Bought by
Project Development & Management Llc
Home Financials for this Owner
Home Financials are based on the most recent Mortgage that was taken out on this home.
Original Mortgage
$110,778
Interest Rate
4.82%
Mortgage Type
Unknown
Create a Home Valuation Report for This Property
The Home Valuation Report is an in-depth analysis detailing your home's value as well as a comparison with similar homes in the area
Home Values in the Area
Average Home Value in this Area
Purchase History
| Date | Buyer | Sale Price | Title Company |
|---|---|---|---|
| Threatt Lakendra C | $118,000 | -- | |
| Williams James L | $119,900 | None Available | |
| Project Development & Management Llc | $17,510 | None Available |
Source: Public Records
Mortgage History
| Date | Status | Borrower | Loan Amount |
|---|---|---|---|
| Open | Threatt Lakendra C | $115,862 | |
| Previous Owner | Williams James L | $116,860 | |
| Previous Owner | Project Development & Management Llc | $110,778 |
Source: Public Records
Tax History Compared to Growth
Tax History
| Year | Tax Paid | Tax Assessment Tax Assessment Total Assessment is a certain percentage of the fair market value that is determined by local assessors to be the total taxable value of land and additions on the property. | Land | Improvement |
|---|---|---|---|---|
| 2025 | $1,767 | $71,918 | $10,000 | $61,918 |
| 2024 | $1,827 | $71,918 | $10,000 | $61,918 |
| 2023 | $1,777 | $69,962 | $10,000 | $59,962 |
| 2022 | $2,064 | $59,629 | $8,000 | $51,629 |
| 2021 | $2,157 | $56,770 | $7,600 | $49,170 |
| 2020 | $1,887 | $48,595 | $6,800 | $41,795 |
| 2019 | $1,902 | $48,595 | $6,800 | $41,795 |
| 2018 | $2,887 | $45,153 | $6,800 | $38,353 |
| 2017 | $1,636 | $43,678 | $6,800 | $36,878 |
| 2016 | $1,067 | $37,845 | $5,950 | $31,895 |
| 2015 | $1,511 | $37,845 | $5,950 | $31,895 |
| 2014 | $1,484 | $37,237 | $5,950 | $31,287 |
Source: Public Records
Map
Nearby Homes
- 411 Bob White Rd
- 428 Bob White Rd
- 465 Bob White Rd
- 408 Resting Fawn Place
- DUPONT Plan at Quail Ridge
- GARDNER Plan at Quail Ridge
- KINGSTON Plan at Quail Ridge
- ESSEX Plan at Quail Ridge
- 708 Coopers Lnd
- 436 Joseph Chandler Dr
- 3160 Walden Rd
- 116 Wynens Way
- 405 Stonecrest Ct
- 813 Ocala National Trail
- 214 Golden Ocala Blvd
- 6530 Bevin Dr
- 102 Haylie Ct
- 330 Cody Dr
- 104 Alayna Ct
- 511 Bob White Rd
- 509 Bob White Rd
- 0 Sweetgum Way Unit 8666181
- 0 Sweetgum Way Unit 8529937
- 0 Sweetgum Way Unit 7209430
- 0 Sweetgum Way Unit 7376398
- 0 Bob White Rd Unit 7425942
- 0 Bob White Rd Unit 8549632
- 0 Bob White Rd Unit 8555344
- 0 Bob White Rd Unit 8554005
- 0 Bob White Rd Unit 8296093
- 0 Bob White Rd Unit 7610475
- 0 Bob White Rd Unit 8724872
- 0 Bob White Rd Unit 7254138
- 0 Bob White Rd Unit 7207629
- 0 Bob White Rd Unit 9012372
- 0 Bob White Rd Unit 9024268
- 0 Bob White Rd Unit 8791550
- 0 Bob White Rd Unit 8935528
- 0 Bob White Rd Unit 3224525