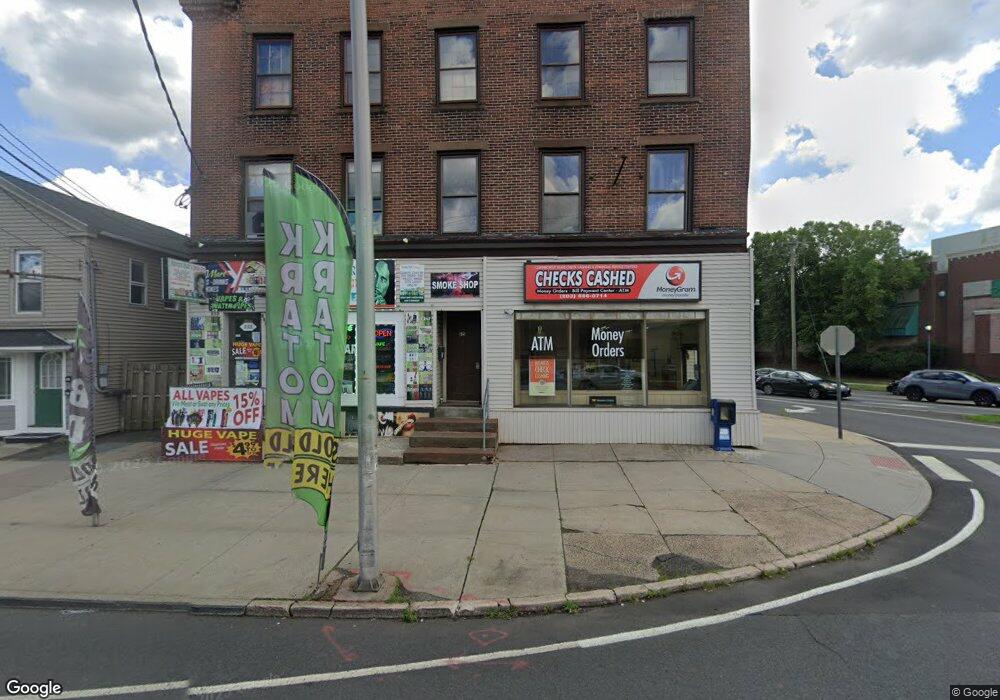
511 Broad St Meriden, CT 06450
Estimated Value: $160,000 - $224,000
2
Beds
2
Baths
1,056
Sq Ft
$179/Sq Ft
Est. Value
About This Home
This home is located at 511 Broad St, Meriden, CT 06450 and is currently estimated at $188,858, approximately $178 per square foot. 511 Broad St is a home located in New Haven County with nearby schools including Roger Sherman Elementary School, Washington Middle School, and Francis T. Maloney High School.
Ownership History
Date
Name
Owned For
Owner Type
Purchase Details
Closed on
Mar 31, 2006
Sold by
Cil Rlty Inc
Bought by
Cajigas Iris and Rivera Maria
Current Estimated Value
Home Financials for this Owner
Home Financials are based on the most recent Mortgage that was taken out on this home.
Original Mortgage
$115,050
Interest Rate
6.32%
Purchase Details
Closed on
Apr 4, 1988
Sold by
Cil Realty Assoc
Bought by
Cil Realty Inc
Home Financials for this Owner
Home Financials are based on the most recent Mortgage that was taken out on this home.
Original Mortgage
$52,000
Interest Rate
9.89%
Create a Home Valuation Report for This Property
The Home Valuation Report is an in-depth analysis detailing your home's value as well as a comparison with similar homes in the area
Home Values in the Area
Average Home Value in this Area
Purchase History
| Date | Buyer | Sale Price | Title Company |
|---|---|---|---|
| Cajigas Iris | $116,000 | -- | |
| Cil Realty Inc | $142,152 | -- |
Source: Public Records
Mortgage History
| Date | Status | Borrower | Loan Amount |
|---|---|---|---|
| Open | Cil Realty Inc | $104,361 | |
| Closed | Cil Realty Inc | $115,050 | |
| Previous Owner | Cil Realty Inc | $52,000 | |
| Previous Owner | Cil Realty Inc | $150,000 |
Source: Public Records
Tax History Compared to Growth
Tax History
| Year | Tax Paid | Tax Assessment Tax Assessment Total Assessment is a certain percentage of the fair market value that is determined by local assessors to be the total taxable value of land and additions on the property. | Land | Improvement |
|---|---|---|---|---|
| 2024 | $2,376 | $65,450 | $0 | $65,450 |
| 2023 | $2,277 | $65,450 | $0 | $65,450 |
| 2022 | $2,159 | $65,450 | $0 | $65,450 |
| 2021 | $1,530 | $37,450 | $0 | $37,450 |
| 2020 | $1,530 | $37,450 | $0 | $37,450 |
| 2019 | $1,530 | $37,450 | $0 | $37,450 |
| 2018 | $1,537 | $37,450 | $0 | $37,450 |
| 2017 | $1,495 | $37,450 | $0 | $37,450 |
| 2016 | $2,315 | $63,210 | $0 | $63,210 |
| 2015 | $2,315 | $63,210 | $0 | $63,210 |
| 2014 | $2,259 | $63,210 | $0 | $63,210 |
Source: Public Records
Map
Nearby Homes