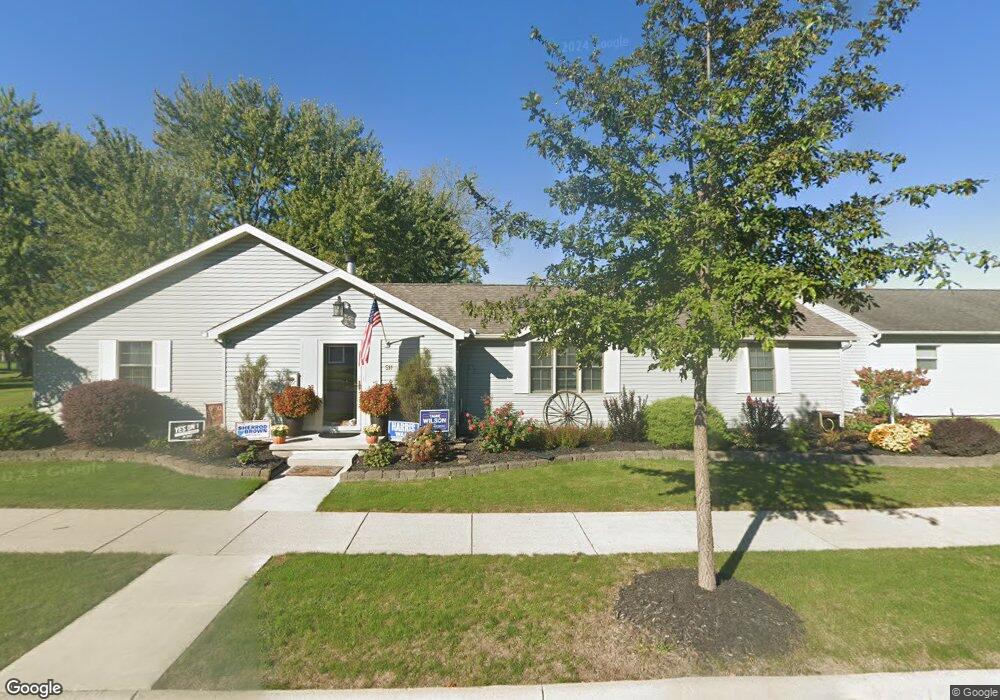
511 Buchanan St Wapakoneta, OH 45895
Estimated Value: $193,000 - $304,000
4
Beds
2
Baths
2,521
Sq Ft
$91/Sq Ft
Est. Value
About This Home
This home is located at 511 Buchanan St, Wapakoneta, OH 45895 and is currently estimated at $230,008, approximately $91 per square foot. 511 Buchanan St is a home located in Auglaize County with nearby schools including Wapakoneta Elementary School, Wapakoneta High School, and Wapakoneta Middle School.
Ownership History
Date
Name
Owned For
Owner Type
Purchase Details
Closed on
Dec 14, 2011
Sold by
Koenig Aaron D and Koenig Heide C
Bought by
Wiener Douglas L
Current Estimated Value
Home Financials for this Owner
Home Financials are based on the most recent Mortgage that was taken out on this home.
Original Mortgage
$132,552
Outstanding Balance
$90,718
Interest Rate
4.02%
Mortgage Type
FHA
Estimated Equity
$139,290
Purchase Details
Closed on
Sep 20, 2001
Sold by
Longworth Heide C
Bought by
Koenig Aaron D
Purchase Details
Closed on
Jul 10, 1997
Sold by
Ott Leonard E
Bought by
Longworth Heide C
Create a Home Valuation Report for This Property
The Home Valuation Report is an in-depth analysis detailing your home's value as well as a comparison with similar homes in the area
Home Values in the Area
Average Home Value in this Area
Purchase History
| Date | Buyer | Sale Price | Title Company |
|---|---|---|---|
| Wiener Douglas L | $136,000 | Attorney | |
| Koenig Aaron D | -- | -- | |
| Longworth Heide C | $52,400 | -- |
Source: Public Records
Mortgage History
| Date | Status | Borrower | Loan Amount |
|---|---|---|---|
| Open | Wiener Douglas L | $132,552 |
Source: Public Records
Tax History Compared to Growth
Tax History
| Year | Tax Paid | Tax Assessment Tax Assessment Total Assessment is a certain percentage of the fair market value that is determined by local assessors to be the total taxable value of land and additions on the property. | Land | Improvement |
|---|---|---|---|---|
| 2024 | $2,347 | $48,150 | $10,610 | $37,540 |
| 2023 | $1,575 | $48,150 | $10,610 | $37,540 |
| 2022 | $1,602 | $45,360 | $9,720 | $35,640 |
| 2021 | $781 | $45,360 | $9,720 | $35,640 |
| 2020 | $1,586 | $45,367 | $9,723 | $35,644 |
| 2019 | $1,360 | $37,314 | $7,998 | $29,316 |
| 2018 | $1,364 | $37,314 | $7,998 | $29,316 |
| 2017 | $1,357 | $37,314 | $7,998 | $29,316 |
| 2016 | $1,384 | $38,196 | $7,501 | $30,695 |
| 2015 | $1,365 | $38,196 | $7,501 | $30,695 |
| 2014 | $1,379 | $38,196 | $7,501 | $30,695 |
| 2013 | $1,404 | $38,196 | $7,501 | $30,695 |
Source: Public Records
Map
Nearby Homes