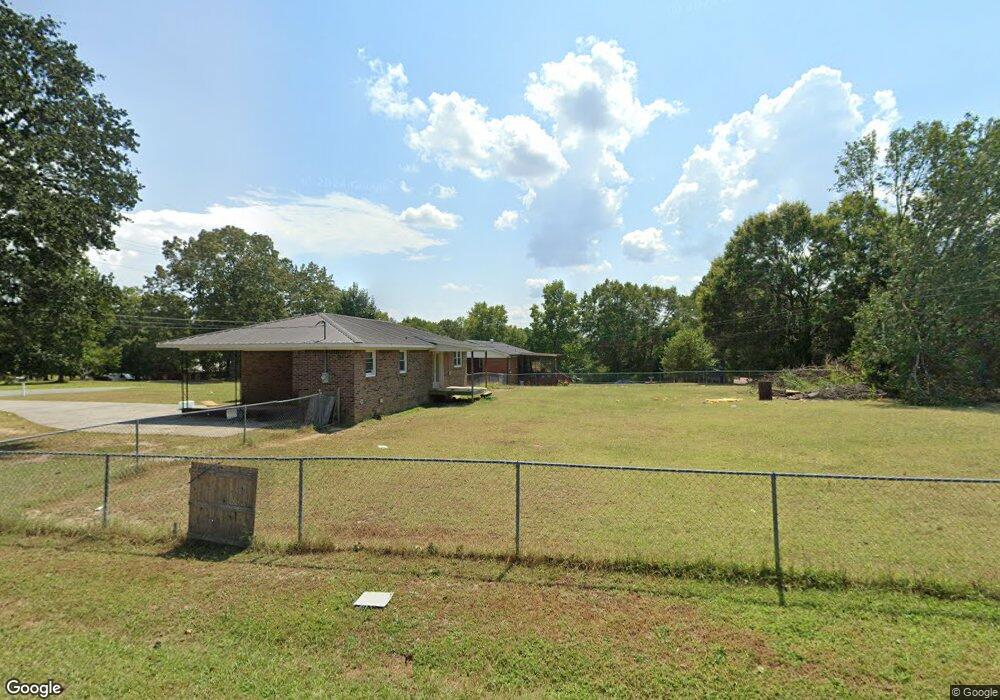
511 Campbell Rd SE Calhoun, GA 30701
Estimated Value: $175,000 - $201,000
3
Beds
1
Bath
976
Sq Ft
$193/Sq Ft
Est. Value
About This Home
This home is located at 511 Campbell Rd SE, Calhoun, GA 30701 and is currently estimated at $188,793, approximately $193 per square foot. 511 Campbell Rd SE is a home located in Gordon County with nearby schools including Sonoraville Elementary School, Red Bud Middle School, and Sonoraville High School.
Ownership History
Date
Name
Owned For
Owner Type
Purchase Details
Closed on
Aug 8, 2011
Sold by
Casey Jerry
Bought by
Bailey Sara Ann
Current Estimated Value
Purchase Details
Closed on
Aug 25, 2010
Sold by
Secretary Of Housing & Urban Development
Bought by
Casey Jerry
Purchase Details
Closed on
Mar 3, 2010
Sold by
King Gary L
Bought by
Central Mortgage Company
Purchase Details
Closed on
Mar 3, 2009
Sold by
Central Mortgage Company
Bought by
Secretary Of Housing & Urban Development
Purchase Details
Closed on
Apr 30, 2008
Sold by
Pfw Properties Inc
Bought by
King Gary
Home Financials for this Owner
Home Financials are based on the most recent Mortgage that was taken out on this home.
Original Mortgage
$83,630
Interest Rate
5.86%
Mortgage Type
FHA
Purchase Details
Closed on
Aug 1, 2006
Sold by
Bynum Barbara J
Bought by
Pfw Properties Inc
Purchase Details
Closed on
Oct 6, 2003
Sold by
Bynum Barbara B
Bought by
Hancock Judy and Hancock Thomas E
Create a Home Valuation Report for This Property
The Home Valuation Report is an in-depth analysis detailing your home's value as well as a comparison with similar homes in the area
Home Values in the Area
Average Home Value in this Area
Purchase History
| Date | Buyer | Sale Price | Title Company |
|---|---|---|---|
| Bailey Sara Ann | $61,000 | -- | |
| Casey Jerry | $35,901 | -- | |
| Central Mortgage Company | $80,800 | -- | |
| Secretary Of Housing & Urban Development | $80,800 | -- | |
| Secretary Of Housing And Urban Developme | $80,827 | -- | |
| Central Mortgage Company | $80,827 | -- | |
| King Gary | $84,943 | -- | |
| Pfw Properties Inc | $56,743 | -- | |
| Hancock Judy | $50,000 | -- |
Source: Public Records
Mortgage History
| Date | Status | Borrower | Loan Amount |
|---|---|---|---|
| Previous Owner | King Gary | $83,630 | |
| Closed | Bailey Sara Ann | $0 |
Source: Public Records
Tax History Compared to Growth
Tax History
| Year | Tax Paid | Tax Assessment Tax Assessment Total Assessment is a certain percentage of the fair market value that is determined by local assessors to be the total taxable value of land and additions on the property. | Land | Improvement |
|---|---|---|---|---|
| 2024 | $322 | $37,576 | $4,200 | $33,376 |
| 2023 | $302 | $35,416 | $4,200 | $31,216 |
| 2022 | $300 | $33,496 | $4,200 | $29,296 |
| 2021 | $242 | $27,456 | $4,200 | $23,256 |
| 2020 | $248 | $27,820 | $4,200 | $23,620 |
| 2019 | $249 | $27,820 | $4,200 | $23,620 |
| 2018 | $222 | $25,080 | $4,200 | $20,880 |
| 2017 | $215 | $23,840 | $4,200 | $19,640 |
| 2016 | $215 | $23,840 | $4,200 | $19,640 |
| 2015 | $223 | $24,452 | $4,200 | $20,252 |
| 2014 | $209 | $23,462 | $4,200 | $19,262 |
Source: Public Records
Map
Nearby Homes
- 137 Hunters Trail SE
- 3171 Dews Pond Rd SE
- 106 Valley View Cir SE
- 170 Willow Haven St SE
- 187 Willow Haven St SE
- 166 Woodford Way SE
- 190 Woodford Way SE
- 279 Baker Rd SE
- 145 Water Wheel Ln SE
- 408 Peachtree Ln SE
- 127 Alex Ct
- 194 Cardinal Blvd SE
- 130 Burnt Hickory Ln SE
- 192 Cardinal Blvd SE
- 254 Gravely Rd SE
- 4134 Dews Pond Rd SE
- 523 Campbell Rd SE
- 489 Campbell Rd SE
- 120 Rolling Acres 2nd St SE
- 0 Campbell Rd SE Unit 8581620
- 0 Campbell Rd SE
- 121 Rolling Acres 3rd St SE
- 104 Rolling Acres 3rd St SE
- 2Nd 2nd St
- 104 3rd Ave SE
- 137 Rolling Acres 3rd St SE
- 487 Campbell Rd SE
- 134 Rolling Acres 2nd St SE
- 119 Rolling St SE Unit ACRES 2ND
- 119 Rolling Acres 2nd St SE
- 218 Rolling Acres 3rd St SE
- 538 Campbell Rd SE
- 490 Campbell Rd SE
- 571 Campbell Rd SE
- 138 Rolling Acres 3rd St SE
- 417 Campbell Rd SE