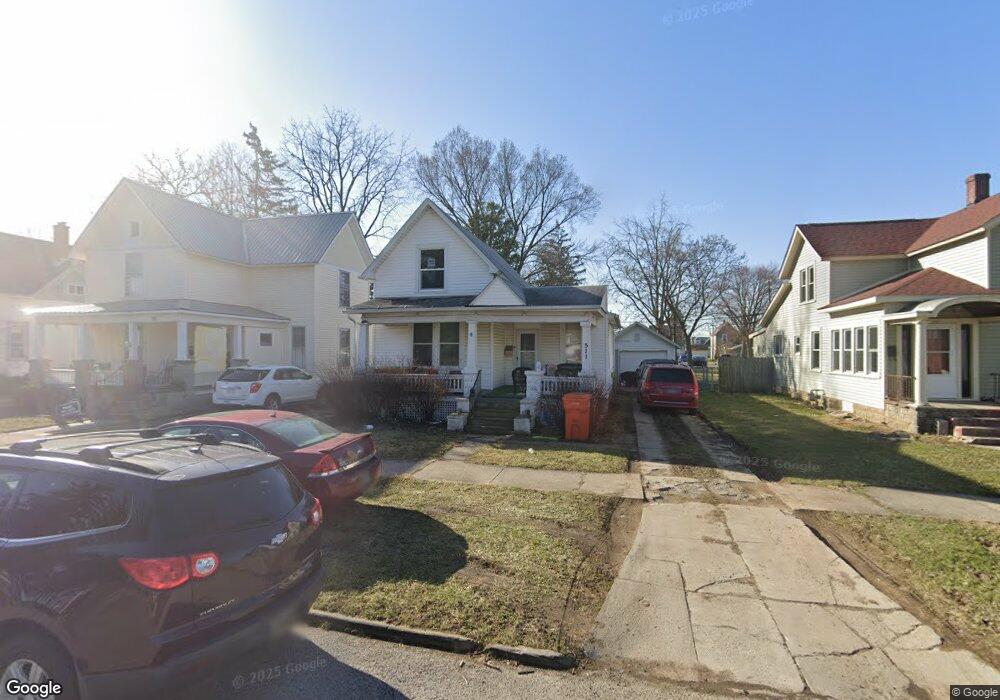
511 Cherry St Findlay, OH 45840
Estimated Value: $132,041 - $168,000
3
Beds
1
Bath
1,268
Sq Ft
$121/Sq Ft
Est. Value
About This Home
This home is located at 511 Cherry St, Findlay, OH 45840 and is currently estimated at $153,260, approximately $120 per square foot. 511 Cherry St is a home located in Hancock County with nearby schools including Whittier Elementary School, Wilson Vance Elementary School, and Donnell Middle School.
Ownership History
Date
Name
Owned For
Owner Type
Purchase Details
Closed on
Aug 31, 2010
Sold by
Fannie Mae
Bought by
Rb Rentals Llc
Current Estimated Value
Purchase Details
Closed on
Jun 28, 2010
Sold by
Collins John
Bought by
Federal National Mortgage Association
Purchase Details
Closed on
Sep 13, 1994
Sold by
Oler Robert
Bought by
Collins John and Collins Dawn
Home Financials for this Owner
Home Financials are based on the most recent Mortgage that was taken out on this home.
Original Mortgage
$47,341
Interest Rate
8.65%
Mortgage Type
FHA
Purchase Details
Closed on
Jan 4, 1989
Bought by
Oler Robert A and Oler Jane E
Purchase Details
Closed on
May 2, 1986
Bought by
Orwick Todd W
Purchase Details
Closed on
Jun 23, 1982
Bought by
Heitmeyer Henrietta L
Create a Home Valuation Report for This Property
The Home Valuation Report is an in-depth analysis detailing your home's value as well as a comparison with similar homes in the area
Home Values in the Area
Average Home Value in this Area
Purchase History
| Date | Buyer | Sale Price | Title Company |
|---|---|---|---|
| Rb Rentals Llc | $26,266 | Omega Title Agency | |
| Federal National Mortgage Association | $23,334 | Attorney | |
| Collins John | $46,900 | -- | |
| Oler Robert A | $33,000 | -- | |
| Orwick Todd W | $28,000 | -- | |
| Heitmeyer Henrietta L | -- | -- |
Source: Public Records
Mortgage History
| Date | Status | Borrower | Loan Amount |
|---|---|---|---|
| Previous Owner | Collins John | $47,341 |
Source: Public Records
Tax History
| Year | Tax Paid | Tax Assessment Tax Assessment Total Assessment is a certain percentage of the fair market value that is determined by local assessors to be the total taxable value of land and additions on the property. | Land | Improvement |
|---|---|---|---|---|
| 2024 | $1,333 | $36,580 | $5,080 | $31,500 |
| 2023 | $1,336 | $36,580 | $5,080 | $31,500 |
| 2022 | $1,331 | $36,580 | $5,080 | $31,500 |
| 2021 | $1,249 | $29,910 | $5,340 | $24,570 |
| 2020 | $1,249 | $29,910 | $5,340 | $24,570 |
| 2019 | $1,225 | $29,910 | $5,340 | $24,570 |
| 2018 | $1,163 | $26,070 | $4,650 | $21,420 |
| 2017 | $1,164 | $26,070 | $4,650 | $21,420 |
| 2016 | $1,157 | $26,070 | $4,650 | $21,420 |
| 2015 | $907 | $20,170 | $4,650 | $15,520 |
| 2014 | $907 | $20,170 | $4,650 | $15,520 |
| 2012 | $829 | $18,280 | $4,650 | $13,630 |
Source: Public Records
Map
Nearby Homes
- 523 Center St
- 640 Center St
- 213 Cherry St
- 125 Cherry St
- 439 Carnahan Ave
- 810 Mcconnell St
- 741 Central Ave
- 1020 Country Club Dr
- 204 Laquineo St
- 706 N Cory St
- 1125 Glen Meadow Dr
- 322 Midland Ave
- 716 Winfield Ave
- 407 Washington St
- 912 Parkside Place
- 301 Allen Ave
- 206 Midland Ave
- 1209 Heather Dr
- 1001 Decker Ave
- 1308 Greendale Ave
Your Personal Tour Guide
Ask me questions while you tour the home.