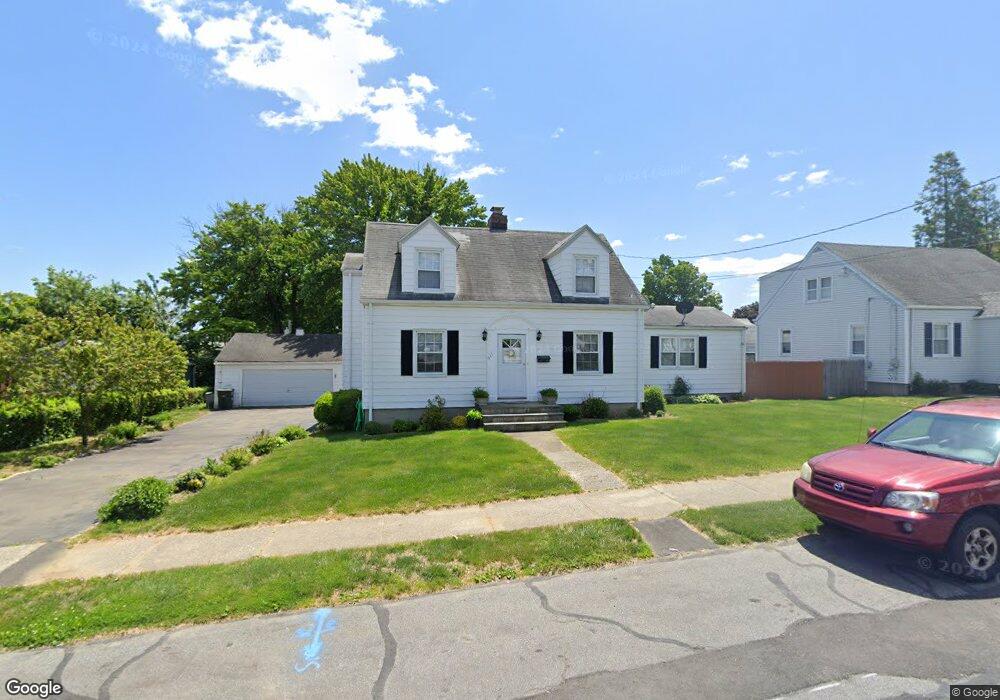
511 Clark St Bridgeport, CT 06606
North End NeighborhoodEstimated Value: $455,964 - $539,000
4
Beds
3
Baths
1,624
Sq Ft
$296/Sq Ft
Est. Value
About This Home
This home is located at 511 Clark St, Bridgeport, CT 06606 and is currently estimated at $480,741, approximately $296 per square foot. 511 Clark St is a home located in Fairfield County with nearby schools including Blackham School, Central High School, and The Unquowa School.
Ownership History
Date
Name
Owned For
Owner Type
Purchase Details
Closed on
Aug 8, 2024
Sold by
Moura Fernanda G
Bought by
Demoura Children T and Zachery
Current Estimated Value
Purchase Details
Closed on
Sep 16, 1987
Sold by
Lisi Elio
Bought by
Moura Jose
Home Financials for this Owner
Home Financials are based on the most recent Mortgage that was taken out on this home.
Original Mortgage
$75,000
Interest Rate
10.35%
Mortgage Type
Purchase Money Mortgage
Create a Home Valuation Report for This Property
The Home Valuation Report is an in-depth analysis detailing your home's value as well as a comparison with similar homes in the area
Home Values in the Area
Average Home Value in this Area
Purchase History
| Date | Buyer | Sale Price | Title Company |
|---|---|---|---|
| Demoura Children T | -- | None Available | |
| Demoura Children T | -- | None Available | |
| Moura Jose | $190,000 | -- |
Source: Public Records
Mortgage History
| Date | Status | Borrower | Loan Amount |
|---|---|---|---|
| Previous Owner | Moura Jose | $12,331 | |
| Previous Owner | Moura Jose | $68,000 | |
| Previous Owner | Moura Jose | $75,000 |
Source: Public Records
Tax History
| Year | Tax Paid | Tax Assessment Tax Assessment Total Assessment is a certain percentage of the fair market value that is determined by local assessors to be the total taxable value of land and additions on the property. | Land | Improvement |
|---|---|---|---|---|
| 2025 | $7,509 | $172,830 | $80,290 | $92,540 |
| 2024 | $7,509 | $172,830 | $80,290 | $92,540 |
| 2023 | $7,509 | $172,830 | $80,290 | $92,540 |
| 2022 | $7,509 | $172,830 | $80,290 | $92,540 |
| 2021 | $7,509 | $172,830 | $80,290 | $92,540 |
| 2020 | $6,817 | $126,270 | $46,120 | $80,150 |
| 2019 | $6,817 | $126,270 | $46,120 | $80,150 |
| 2018 | $6,865 | $126,270 | $46,120 | $80,150 |
| 2017 | $6,865 | $126,270 | $46,120 | $80,150 |
| 2016 | $6,865 | $126,270 | $46,120 | $80,150 |
| 2015 | $6,623 | $156,940 | $53,290 | $103,650 |
| 2014 | $6,623 | $156,940 | $53,290 | $103,650 |
Source: Public Records
Map
Nearby Homes
- 574 Thorme St
- 604 Birmingham St
- 625 Clark St
- 619 Queen St
- 375 Ruth St
- 26 Marsdale Ave
- 525 Westfield Ave
- 339 Goldenrod Ave
- 405 Westfield Ave
- 720 Queen St
- 260 Toilsome Place
- 234 Savoy St
- 120 Clark St
- 316 Goldenrod Ave
- 671 Fairview Ave
- 932 Thorme St
- 631 Fairview Ave
- 11 Stratfield Place
- 3200 Park Ave Unit 5F1
- 156 Garden Dr Unit 158
Your Personal Tour Guide
Ask me questions while you tour the home.