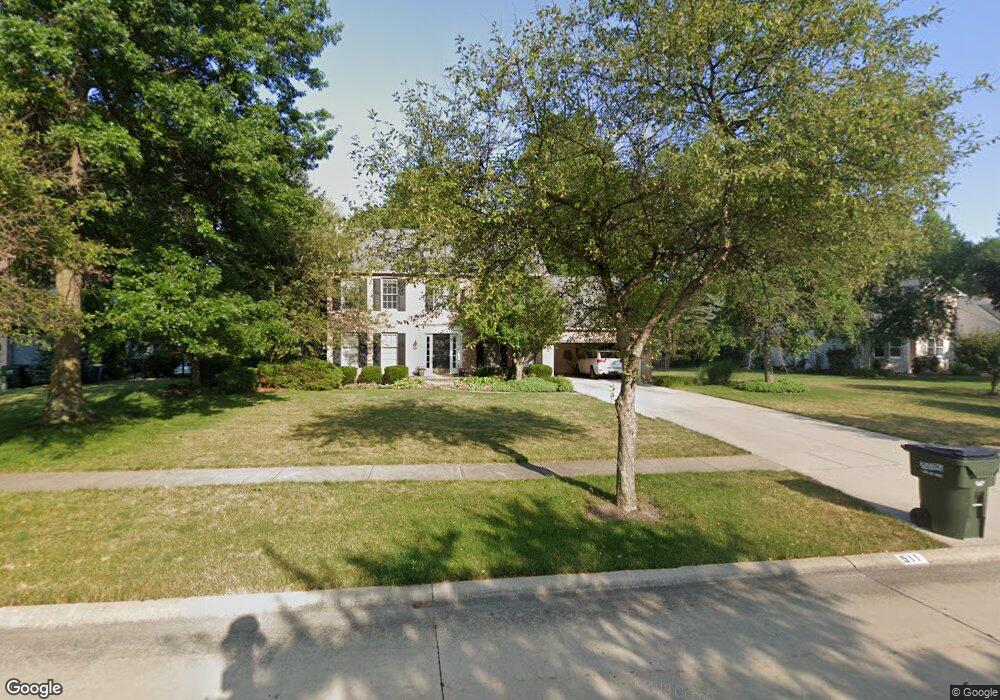
511 Danbury Ln Avon Lake, OH 44012
Estimated Value: $494,000 - $562,000
4
Beds
3
Baths
2,384
Sq Ft
$218/Sq Ft
Est. Value
About This Home
This home is located at 511 Danbury Ln, Avon Lake, OH 44012 and is currently estimated at $519,591, approximately $217 per square foot. 511 Danbury Ln is a home located in Lorain County with nearby schools including Troy Intermediate Elementary School, Erieview Elementary School, and Learwood Middle School.
Ownership History
Date
Name
Owned For
Owner Type
Purchase Details
Closed on
Dec 9, 2013
Sold by
Liederbach Kirk W and Liederbach Judith R
Bought by
Liederbach Juidith R and Liederbach Kirk W
Current Estimated Value
Purchase Details
Closed on
Oct 19, 2005
Sold by
Poole E Brett and Poole Susan H
Bought by
Liederbach Kirk W and Liederbach Judith R
Home Financials for this Owner
Home Financials are based on the most recent Mortgage that was taken out on this home.
Original Mortgage
$65,000
Interest Rate
5.8%
Mortgage Type
Fannie Mae Freddie Mac
Purchase Details
Closed on
Oct 16, 2000
Sold by
Pantley Mark R and Pantley Beverly A
Bought by
Poole E Brett and Poole Susan H
Home Financials for this Owner
Home Financials are based on the most recent Mortgage that was taken out on this home.
Original Mortgage
$230,400
Interest Rate
7.8%
Create a Home Valuation Report for This Property
The Home Valuation Report is an in-depth analysis detailing your home's value as well as a comparison with similar homes in the area
Home Values in the Area
Average Home Value in this Area
Purchase History
| Date | Buyer | Sale Price | Title Company |
|---|---|---|---|
| Liederbach Juidith R | -- | None Available | |
| Liederbach Kirk W | $282,500 | Hometown Usa Title Agency Lt | |
| Poole E Brett | $256,000 | Resource Title Agency Inc |
Source: Public Records
Mortgage History
| Date | Status | Borrower | Loan Amount |
|---|---|---|---|
| Closed | Liederbach Kirk W | $65,000 | |
| Previous Owner | Poole E Brett | $230,400 |
Source: Public Records
Tax History Compared to Growth
Tax History
| Year | Tax Paid | Tax Assessment Tax Assessment Total Assessment is a certain percentage of the fair market value that is determined by local assessors to be the total taxable value of land and additions on the property. | Land | Improvement |
|---|---|---|---|---|
| 2024 | $7,076 | $149,520 | $40,425 | $109,095 |
| 2023 | $6,236 | $117,243 | $30,191 | $87,052 |
| 2022 | $6,171 | $117,243 | $30,191 | $87,052 |
| 2021 | $6,157 | $117,243 | $30,191 | $87,052 |
| 2020 | $5,824 | $102,750 | $26,460 | $76,290 |
| 2019 | $5,794 | $102,750 | $26,460 | $76,290 |
| 2018 | $5,813 | $102,750 | $26,460 | $76,290 |
| 2017 | $5,178 | $84,260 | $25,200 | $59,060 |
| 2016 | $5,152 | $84,260 | $25,200 | $59,060 |
| 2015 | $5,177 | $84,260 | $25,200 | $59,060 |
| 2014 | $5,431 | $84,260 | $25,200 | $59,060 |
| 2013 | $5,473 | $84,260 | $25,200 | $59,060 |
Source: Public Records
Map
Nearby Homes
- 533 Vintage Point Unit 13
- 32651 Walker Rd
- 32581 Captains Galley
- 417 Armour Rd
- 32557 Muirfield Dr
- 80 Landings Way Unit 80
- 51 Landings Way Unit 51
- Rockwall Plan at Legacy Isle - The Estates
- Atwater Plan at Legacy Isle - The Estates
- Deer Valley Plan at Legacy Isle - The Estates
- Truman Plan at Legacy Isle - The Estates
- Skyview Plan at Legacy Isle - The Estates
- Bourges Plan at Legacy Isle - The Estates
- Dresden Plan at Legacy Isle - The Estates
- 30 Landings Way Unit 30
- 620 Congressional Ln
- Ashton Plan at Legacy Isle - The Townhomes
- Bowman Plan at Legacy Isle - The Townhomes
- 32831 Sorrento Ln
- 32601 Royal Troon Dr
- 513 Danbury Ln
- 509 Danbury Ln
- 514 Rockwood Ct
- 512 Rockwood Ct
- 515 Danbury Ln
- 516 Rockwood Ct
- 504 Rockwood Ct
- 506 Rockwood Ct
- 510 Danbury Ln
- 512 Danbury Ln
- 514 Danbury Ln
- 517 Danbury Ln
- 518 Rockwood Ct
- 516 Danbury Ln
- 508 Danbury Ln
- 513 Rockwood Ct
- 519 Danbury Ln
- 520 Rockwood Ct
- 511 Rockwood Ct
- 518 Danbury Ln