511 E 44th St Unit 4409-2 Chicago, IL 60653
Grand Boulevard NeighborhoodEstimated Value: $434,000
About This Home
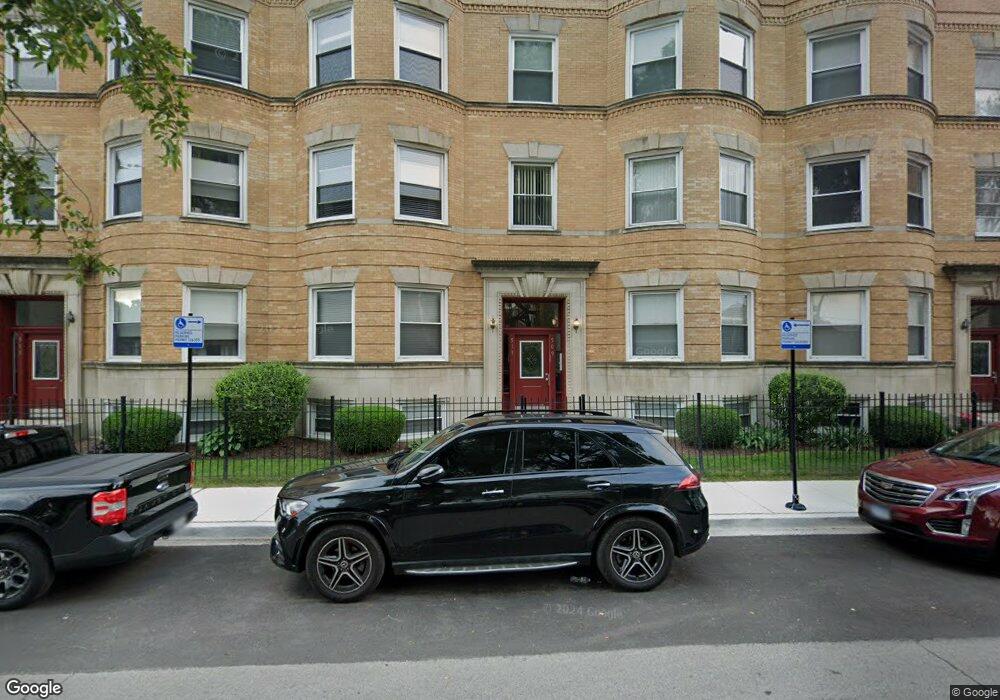
This home is located at 511 E 44th St Unit 4409-2, Chicago, IL 60653 and is currently estimated at $434,000, approximately $256 per square foot. 511 E 44th St Unit 4409-2 is a home located in Cook County with nearby schools including Woodson South Elementary School, UChicago Charter Carter G. Woodson Campus, and Holy Angels Catholic School.
Ownership History
We collect this data history from publicly available records. To have your information removed, we recommend requesting removal directly through your county’s website.
Purchase Details
Purchase Details
Purchase Details
Home Financials for this Owner
Home Financials are based on the most recent Mortgage that was taken out on this home.Purchase Details
Purchase Details
Purchase Details
Purchase Details
Purchase Details
Purchase Details
Purchase Details
Purchase Details
Purchase Details
Purchase Details
Purchase Details
Purchase Details
Purchase Details
Purchase Details
Purchase Details
Purchase Details
Purchase Details
Purchase Details
Purchase Details
Purchase Details
Purchase Details
Purchase Details
Purchase Details
Purchase Details
Purchase Details
Purchase Details
Purchase Details
Purchase Details
Purchase Details
Purchase Details
Purchase Details
Purchase Details
Purchase Details
Purchase Details
Purchase Details
Home Financials for this Owner
Home Financials are based on the most recent Mortgage that was taken out on this home.Purchase Details
Purchase Details
Purchase Details
Purchase Details
Purchase Details
Purchase Details
Purchase Details
Purchase Details
Home Values in the Area
Average Home Value in this Area
Purchase History
We collect this data history from publicly available records. To have your information removed, we recommend requesting removal directly through your county’s website.
| Date | Buyer | Sale Price | Title Company |
|---|---|---|---|
| $375,000 | Chicago Title | ||
| $100,000 | Fidelity National Title | ||
| -- | Boston National Ttl Agcy Llc | ||
| $30,000 | Attorney | ||
| -- | None Available | ||
| -- | Multiple Title | ||
| -- | None Available | ||
| $77,000 | Attorney | ||
| -- | North American Title | ||
| $55,000 | First American Title | ||
| $82,500 | Fidelity National Title | ||
| -- | None Available | ||
| $41,000 | Attorney | ||
| -- | None Available | ||
| -- | First American Title | ||
| -- | First American Title | ||
| -- | Attorney | ||
| $63,500 | None Available | ||
| $53,000 | First American Title | ||
| $70,000 | Fidelity National Title | ||
| $45,500 | Document Processing Solution | ||
| $71,833 | Fidelity National Title | ||
| $46,299 | Attorney | ||
| -- | None Available | ||
| -- | Attorney | ||
| $40,750 | Fidelity National Title | ||
| -- | Premier Title | ||
| $31,500 | None Available | ||
| -- | Fidelity National Title | ||
| $31,715 | None Available | ||
| -- | None Available | ||
| $44,500 | Fidelity National Title | ||
| -- | Fidelity Natl Title Ins Co | ||
| -- | None Available | ||
| $46,500 | First American Title | ||
| -- | None Available | ||
| -- | None Available | ||
| $32,500 | None Available | ||
| -- | None Available | ||
| -- | None Available | ||
| $31,000 | Attorneys Title Guaranty Fun | ||
| -- | Premier Title | ||
| $25,000 | Fidelity National Title | ||
| -- | None Available | ||
| -- | None Available | ||
| -- | None Available | ||
| $9,000 | None Available | ||
| -- | None Available | ||
| $179,000 | Attorneys Title Guaranty Fun |
Mortgage History
We collect this data history from publicly available records. To have your information removed, we recommend requesting removal directly through your county’s website.
| Date | Status | Borrower | Loan Amount |
|---|---|---|---|
| Previous Owner | $90,000 | ||
| Previous Owner | $29,900 |
Tax History
We collect this data history from publicly available records. To have your information removed, we recommend requesting removal directly through your county’s website.
| Year | Tax Paid | Tax Assessment Tax Assessment Total Assessment is a certain percentage of the fair market value that is determined by local assessors to be the total taxable value of land and additions on the property. | Land | Improvement |
|---|---|---|---|---|
| 2025 | $37,500 | $177,152 | $56,459 | $120,693 |
| 2024 | $37,500 | $177,152 | $56,459 | $120,693 |
| 2023 | $36,551 | $177,152 | $56,459 | $120,693 |
| 2022 | $36,551 | $177,152 | $56,459 | $120,693 |
| 2021 | $35,730 | $177,151 | $56,458 | $120,693 |
| 2020 | $38,650 | $173,498 | $27,422 | $146,076 |
| 2019 | $43,767 | $217,840 | $27,422 | $190,418 |
| 2018 | $61,579 | $311,740 | $27,422 | $284,318 |
| 2017 | $59,652 | $277,103 | $22,583 | $254,520 |
| 2016 | $55,501 | $277,103 | $22,583 | $254,520 |
| 2015 | $50,778 | $277,103 | $22,583 | $254,520 |
| 2014 | $50,815 | $273,877 | $19,357 | $254,520 |
| 2013 | $49,811 | $273,877 | $19,357 | $254,520 |
Map
- 4336 S Saint Lawrence Ave Unit G
- 4315 S Forrestville Ave Unit 3S
- 4351 S Vincennes Ave Unit 2
- 530 E 44th Place
- 543 E 43rd St Unit 3W
- 543 E 43rd St Unit 2W
- 543 E 43rd St Unit 2E
- 4441 S Vincennes Ave Unit 3
- 4441 S Vincennes Ave Unit 2
- 4443 S Vincennes Ave Unit 2
- 428 E 44th St
- 4330 S Langley Ave
- 4242 S Vincennes Ave Unit 2
- 421 E 43rd St
- 131 E 43rd St
- 4529 S Vincennes Ave
- 4538 S Saint Lawrence Ave
- 4541 S Forrestville Ave
- 4245 S Langley Ave Unit 3
- 712 E 42nd St
- 544 E 44th St Unit 2
- 544 E 44th St Unit 5443
- 544 E 44th St Unit 5443
- 544 E 44th St Unit 2
- 544 E 44th St
- 544 E 44th St Unit G
- 544 E 44th St Unit 5443
- 544 E 44th St Unit 2
- 544 E 44th St Unit 19
- 544 E 44th St Unit 1
- 544 E 44th St Unit 26
- 544 E 44th St Unit 25
- 544 E 44th St Unit 24
- 544 E 44th St Unit 23
- 544 E 44th St Unit 22
- 544 E 44th St Unit 21
- 544 E 44th St Unit 20
- 544 E 44th St Unit G
- 544 E 44th St Unit 18
- 544 E 44th St Unit 17
Ask me questions while you tour the home.