NOT LISTED FOR SALE

511 E 4th St New Albany, IN 47150

Estimated Value: $173,000 - $575,306

15 Beds
6 Baths
5,928 Sq Ft
$60/Sq Ft Est. Value

Last Sold April 30, 2020

Last sale price $365,000 $62 Per Sq Ft

Est. 3% decrease in value since last sale

Current estimated payment $2,140/month

219 Days on Market

About This Home

As of April 2020

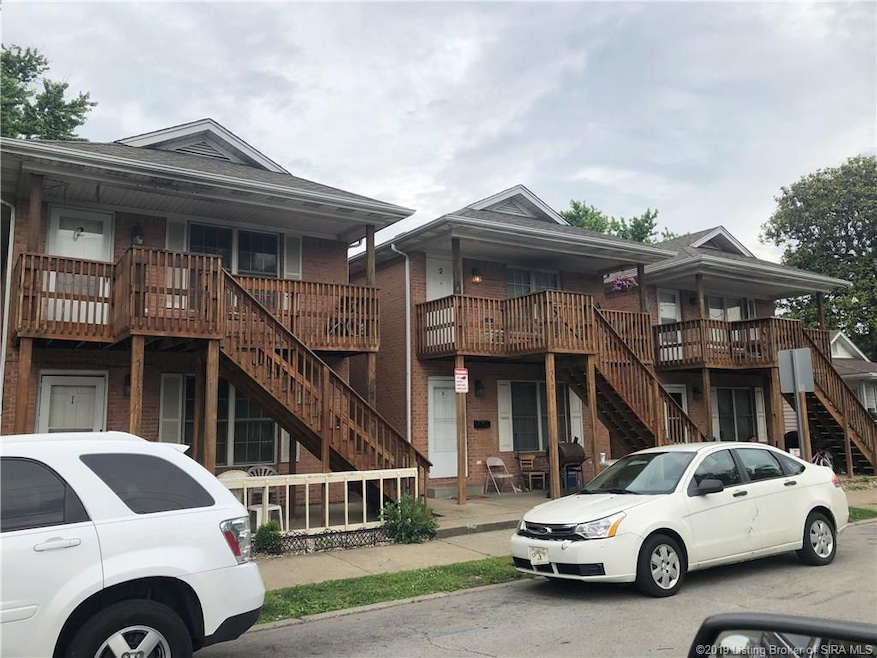
THREE ALL-BRICK, 1995 built DUPLEXES. Each building contains a 3 bedroom unit & a 2 bedroom unit. Current gross monthly rent is $4150. Owner pays water (avg $195 a month for all 3 buildings) & sewer (avg $215 a month for all 3 buildings). Located in BOOMING downtown New Albany, in close proximity to all the shopping and restaurants that downtown has to offer.

Last Listed By

Matt Schaefer

Schaefer Real Estate License #RB14041359 Listed on: 07/20/2019

Home Details

Home Type

  • Single Family

Est. Annual Taxes

  • $4,929

Year Built

  • Built in 1995

Lot Details

  • 9,583 Sq Ft Lot
  • Lot Dimensions are 80x120

Home Design

  • Frame Construction

Interior Spaces

  • 5,928 Sq Ft Home
  • 2-Story Property

Bedrooms and Bathrooms

  • 15 Bedrooms
  • 6 Full Bathrooms

Utilities

  • Forced Air Heating and Cooling System

Listing and Financial Details

  • Assessor Parcel Number 220503500141000008

Home Details

Home Type

Single Family

Est. Annual Taxes

$4,929

Year Built

Built in 1995

Lot Details

0

Listing Details

  • Improvements: 210000
  • Additional Assessor Parcel Numbers: 22-05-03-500-135.000-008&22-05-03-500-130.000-008
  • Annual Tax: 4929
  • Appointment: Mandatory
  • Construction: Existing, Frame On-Site
  • Land Assessment: 19600
  • Legal Description: P. 93 S 25' L. 26; P. 93 N 25' L. 26; P. 93 S 30' L. 28
  • Lot Dimensions: 80x120
  • Parcel Number: 220503500141000008
  • Property Sub Type: Residential
  • Property Type: Residential/Farm
  • Total: 229600
  • Total Finished Square Footage: 5928
  • Type: 2 Story
  • Year Built: 1995
  • Special Features: None

Interior Features

  • Water Heater: Unknown
  • Above Grade Finished Sq Ft: 5928.00
  • Full Bathrooms: 6
  • Total Bathrooms: 6.00
  • Total Bedrooms: 15
  • Lot Sq Ft: 9583.20
  • Room Count: 33
  • Sewer Type: Sewer
  • Total Sq Ft: 5928
  • Total Rooms: 27

Utilities

  • Cooling Type: Central Air
  • Fuel Type: Unknown
  • Heat Type: Forced Air
  • Water Type: Public Onsite

Lot Info

  • Acres: 0.2200

Ownership History

Date Name Owned For Owner Type

Purchase Details

Listed on
Jul 20, 2019
Closed on
Apr 30, 2020
Sold by
Peck Properties Llc
Bought by
New Albany Holdings Llc
Seller's Agent
Matt Schaefer
Schaefer Real Estate
Buyer's Agent
Matt Schaefer
Schaefer Real Estate
List Price
$450,000
Sold Price
$365,000
Premium/Discount to List
-$85,000
-18.89%
Total Days on Market
219
Current Estimated Value
$355,077

Home Financials for this Owner

Home Financials are based on the most recent Mortgage that was taken out on this home.
Estimated Appreciation
-$9,923
Avg. Annual Appreciation
-9.68%

Purchase Details

Closed on
Jun 19, 2014
Sold by
Sceifers Richard Alan
Bought by
Peck Properties Llc

Range of Values:

Collateral Analytics

Collateral Analytics Collateral Analytics AVMs (Automated Valuation Model) employ a number of statistical approaches combined with neighborhood-specific comparable selection guarantees the most up-to-date and precise valuations.

Not Available

Collateral Analytics does not have data for the current month. Please view the chart for historical values.

ICE

ICE Mortgage Technology ICE Mortgage Technology’s AVM (Automated Valuation Model) is a state-of-the-art online residential property valuation tool that provides a quick and accurate estimate of the value of almost any home in the U.S.

Not Available

ICE Mortgage Technology does not have data for the current month. Please view the chart for historical values.

First American

First American First American Data & Analytics’ next-generation AVM combines unrivaled data assets with a blended ensemble of valuation models to produce highly accurate, reliable valuations you can trust.

Not Available

First American does not have data for the current month. Please view the chart for historical values.

Quantarium

Quantarium Quantarium’s valuation service, repeatedly proven the industry’s most accurate and comprehensive, is supercharged with a self-learning and auto-tuning AI engine that continually becomes smarter and more accurate as it processes daily inputs from the industry’s leading RE data lake.

Not Available

Quantarium does not have data for the current month. Please view the chart for historical values.

Average Value
Not Available
List Price
Sold Price
Create a Home Valuation Report for This Property
The Home Valuation Report is an in-depth analysis detailing your home's value as well as a comparison with similar homes in the area

Home Values in the Area

Source: Public Records

Average Home Value in this Area


Source: Public Records

Purchase History

Date Buyer Sale Price Title Company
New Albany Holdings Llc -- None Available
Peck Properties Llc -- --
Source: Public Records

Mortgage History

Date Status Borrower Loan Amount
Previous Owner Sceifers Richard A $81,050
Source: Public Records

Property History

Date Event Price Change Sq Ft Price
04/30/2020 04/30/20 Sold $365,000 -8.8% $62 / Sq Ft
02/24/2020 02/24/20 Pending -- -- --
01/23/2020 01/23/20 Price Changed $400,000 -11.1% $67 / Sq Ft
01/09/2020 01/09/20 For Sale $450,000 0.0% $76 / Sq Ft
12/18/2019 12/18/19 Pending -- -- --
09/07/2019 09/07/19 Price Changed $450,000 -10.0% $76 / Sq Ft
07/20/2019 07/20/19 For Sale $500,000 -- $84 / Sq Ft
Source: Southern Indiana REALTORS® Association

Tax History Compared to Growth

Source: Public Records

Tax History

Year Tax Paid Tax Assessment Tax Assessment Total Assessment is a certain percentage of the fair market value that is determined by local assessors to be the total taxable value of land and additions on the property. Land Improvement
2024 $1,949 $87,300 $6,100 $81,200
2023 $1,949 $91,300 $6,100 $85,200
2022 $1,984 $92,900 $6,100 $86,800
2021 $1,851 $86,000 $6,100 $79,900
2020 $1,815 $84,200 $6,100 $78,100
2019 $1,650 $76,500 $6,100 $70,400
2018 $1,641 $75,600 $6,100 $69,500
2017 $1,667 $75,500 $6,100 $69,400
2016 $1,520 $94,000 $6,100 $87,900
2014 $1,446 $72,300 $6,100 $66,200
2013 -- $66,000 $6,100 $59,900
Source: Public Records

Agents Affiliated with this Home

  • Section Image
See All Agents

Map

Source: Southern Indiana REALTORS® Association

MLS Number: 201909446

Southern Indiana REALTORS® Association

APN: 22-05-03-500-141.000-008