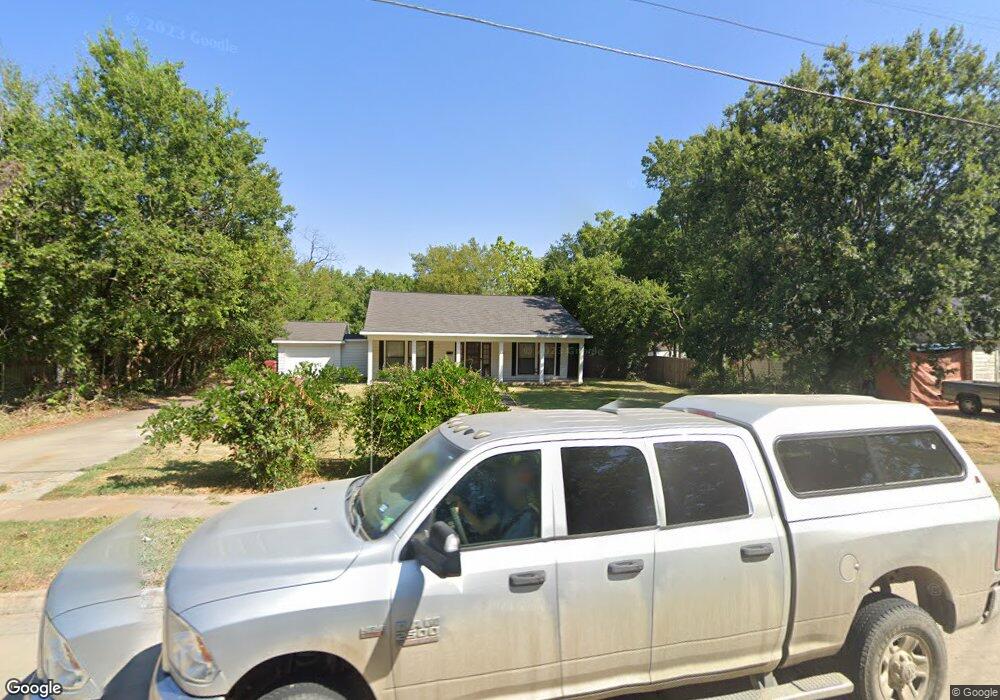
511 E 9th St Bonham, TX 75418
Estimated Value: $217,817 - $242,000
3
Beds
2
Baths
1,606
Sq Ft
$143/Sq Ft
Est. Value
About This Home
This home is located at 511 E 9th St, Bonham, TX 75418 and is currently estimated at $230,454, approximately $143 per square foot. 511 E 9th St is a home located in Fannin County with nearby schools including Evans Elementary School, Finley-Oates Elementary School, and LH Rather Jr High School.
Ownership History
Date
Name
Owned For
Owner Type
Purchase Details
Closed on
May 14, 2021
Sold by
Ward Joy N
Bought by
Latham Emily M
Current Estimated Value
Purchase Details
Closed on
May 13, 2021
Sold by
Latham Emily M
Bought by
Ward Joy N
Purchase Details
Closed on
Aug 30, 2012
Sold by
Peacock Lindsey and Peacock Carol M
Bought by
Glasscock Stacy D
Home Financials for this Owner
Home Financials are based on the most recent Mortgage that was taken out on this home.
Original Mortgage
$74,489
Interest Rate
3.56%
Mortgage Type
New Conventional
Purchase Details
Closed on
Mar 13, 2009
Sold by
Kueckelhan Deanya and Grail Deanya
Bought by
Peacock Lindsey and Peacock Carol M
Create a Home Valuation Report for This Property
The Home Valuation Report is an in-depth analysis detailing your home's value as well as a comparison with similar homes in the area
Purchase History
| Date | Buyer | Sale Price | Title Company |
|---|---|---|---|
| Latham Emily M | -- | None Available | |
| Ward Joy N | -- | None Listed On Document | |
| Glasscock Stacy D | -- | Cole Title Co | |
| Peacock Lindsey | -- | None Available |
Source: Public Records
Mortgage History
| Date | Status | Borrower | Loan Amount |
|---|---|---|---|
| Previous Owner | Glasscock Stacy D | $74,489 |
Source: Public Records
Tax History
| Year | Tax Paid | Tax Assessment Tax Assessment Total Assessment is a certain percentage of the fair market value that is determined by local assessors to be the total taxable value of land and additions on the property. | Land | Improvement |
|---|---|---|---|---|
| 2025 | $4,256 | $234,560 | $68,800 | $165,760 |
| 2024 | $3,665 | $244,190 | $67,780 | $176,410 |
| 2023 | $3,576 | $232,830 | $55,240 | $177,590 |
| 2022 | $3,626 | $199,000 | $39,820 | $159,180 |
| 2021 | $3,754 | $148,550 | $18,470 | $130,080 |
| 2020 | $3,032 | $145,420 | $16,440 | $128,980 |
| 2019 | $2,865 | $133,930 | $8,300 | $125,630 |
| 2018 | $2,601 | $111,720 | $6,950 | $104,770 |
| 2017 | $2,278 | $93,230 | $6,950 | $86,280 |
| 2016 | $2,070 | $81,010 | $6,950 | $74,060 |
| 2015 | -- | $75,670 | $6,610 | $69,060 |
| 2014 | -- | $72,530 | $5,330 | $67,200 |
Source: Public Records
Map
Nearby Homes
Your Personal Tour Guide
Ask me questions while you tour the home.