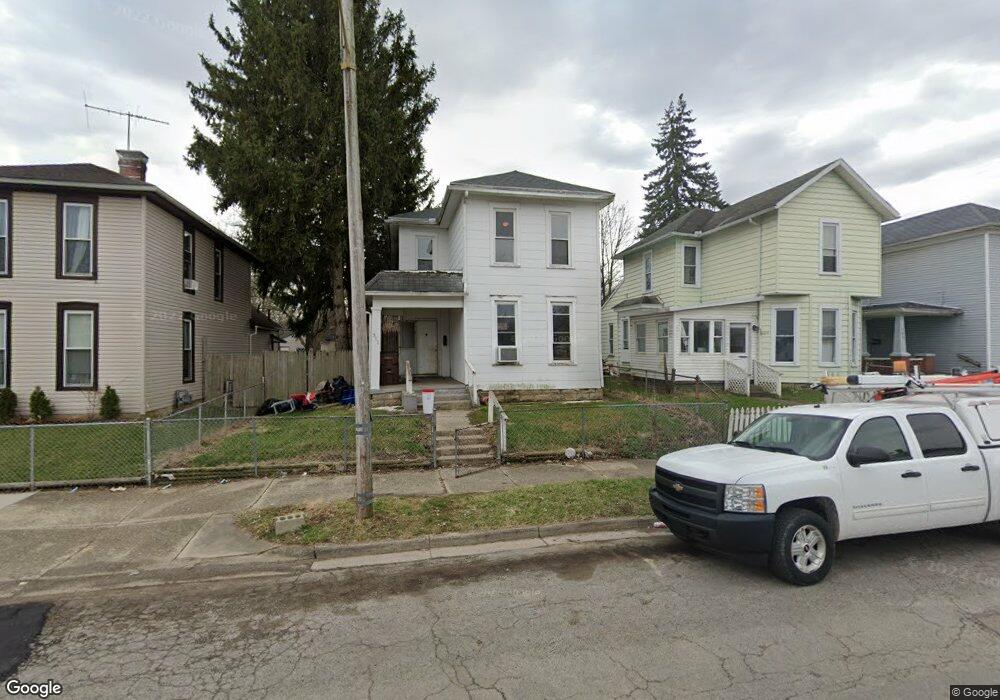
511 E Southern Ave Springfield, OH 45505
Estimated Value: $77,000 - $125,134
2
Beds
1
Bath
1,272
Sq Ft
$78/Sq Ft
Est. Value
About This Home
This home is located at 511 E Southern Ave, Springfield, OH 45505 and is currently estimated at $99,534, approximately $78 per square foot. 511 E Southern Ave is a home located in Clark County with nearby schools including Lincoln Elementary School, Hayward Middle School, and Springfield High School.
Ownership History
Date
Name
Owned For
Owner Type
Purchase Details
Closed on
Nov 7, 2018
Sold by
M & J Quinn Properties Llc
Bought by
Gurda Enterprises Inc
Current Estimated Value
Purchase Details
Closed on
Dec 29, 2016
Sold by
Nowak Martin S
Bought by
M & J Quinn Properties Llc
Home Financials for this Owner
Home Financials are based on the most recent Mortgage that was taken out on this home.
Interest Rate
4.32%
Purchase Details
Closed on
Jun 19, 2006
Sold by
The Bank Of New York
Bought by
Nowak Martin S and Nowak Joann J
Purchase Details
Closed on
Jan 24, 2005
Sold by
Lynch James H
Bought by
The Bank Of New York and Eqcc Asset Backed Certificates Series 20
Purchase Details
Closed on
Oct 20, 1999
Sold by
Mcwilliams Carol V
Bought by
Lynch James H
Home Financials for this Owner
Home Financials are based on the most recent Mortgage that was taken out on this home.
Original Mortgage
$37,600
Interest Rate
8.75%
Mortgage Type
Purchase Money Mortgage
Create a Home Valuation Report for This Property
The Home Valuation Report is an in-depth analysis detailing your home's value as well as a comparison with similar homes in the area
Home Values in the Area
Average Home Value in this Area
Purchase History
| Date | Buyer | Sale Price | Title Company |
|---|---|---|---|
| Gurda Enterprises Inc | $105,000 | None Available | |
| M & J Quinn Properties Llc | $100,000 | -- | |
| Nowak Martin S | $7,500 | None Available | |
| The Bank Of New York | $10,000 | None Available | |
| Lynch James H | -- | -- |
Source: Public Records
Mortgage History
| Date | Status | Borrower | Loan Amount |
|---|---|---|---|
| Previous Owner | M & J Quinn Properties Llc | -- | |
| Previous Owner | Lynch James H | $37,600 |
Source: Public Records
Tax History
| Year | Tax Paid | Tax Assessment Tax Assessment Total Assessment is a certain percentage of the fair market value that is determined by local assessors to be the total taxable value of land and additions on the property. | Land | Improvement |
|---|---|---|---|---|
| 2025 | $404 | $11,040 | $1,020 | $10,020 |
| 2024 | $394 | $7,970 | $880 | $7,090 |
| 2023 | $394 | $7,970 | $880 | $7,090 |
| 2022 | $403 | $7,970 | $880 | $7,090 |
| 2021 | $362 | $6,590 | $730 | $5,860 |
| 2020 | $363 | $6,590 | $730 | $5,860 |
| 2019 | $364 | $6,590 | $730 | $5,860 |
| 2018 | $156 | $2,720 | $690 | $2,030 |
| 2017 | $156 | $2,727 | $693 | $2,034 |
| 2016 | $157 | $2,727 | $693 | $2,034 |
| 2015 | $78 | $2,657 | $693 | $1,964 |
| 2014 | $155 | $2,657 | $693 | $1,964 |
| 2013 | $153 | $2,657 | $693 | $1,964 |
Source: Public Records
Map
Nearby Homes
- 550 E Rose St
- 441 E Euclid Ave
- 230 Rice St
- 1008 Tibbetts Ave
- 652 E Southern Ave
- 1502 Linden Ave
- 205 E Grand Ave
- 1417 Clifton Ave Unit 1419
- 900 E Rose St
- 1724 Clay St
- 705 York St
- 625 Tibbetts Ave
- 907-913 S Limestone St
- 0 W Perrin Ave Unit 1043508
- 0 W Perrin Ave Unit 951292
- 718 Summer St
- 1355 S Fountain Ave
- 1111 Lafayette Ave
- 1820 Clay St
- 1823 Clay St
- 509 E Southern Ave
- 505 E Southern Ave
- 519 E Southern Ave
- 501 E Southern Ave
- 521 E Southern Ave
- 441 E Southern Ave
- 523 E Southern Ave
- 506 Rice St
- 508 Rice St
- 437 E Southern Ave
- 502 Rice St
- 510 Rice St
- 525 E Southern Ave
- 444 Rice St
- 512 E Southern Ave
- 508 E Southern Ave
- 514 E Southern Ave
- 529 E Southern Ave
- 504 E Southern Ave
- 516 E Southern Ave
Your Personal Tour Guide
Ask me questions while you tour the home.