Estimated Value: $230,000 - $266,000
4
Beds
3
Baths
1,974
Sq Ft
$124/Sq Ft
Est. Value
About This Home
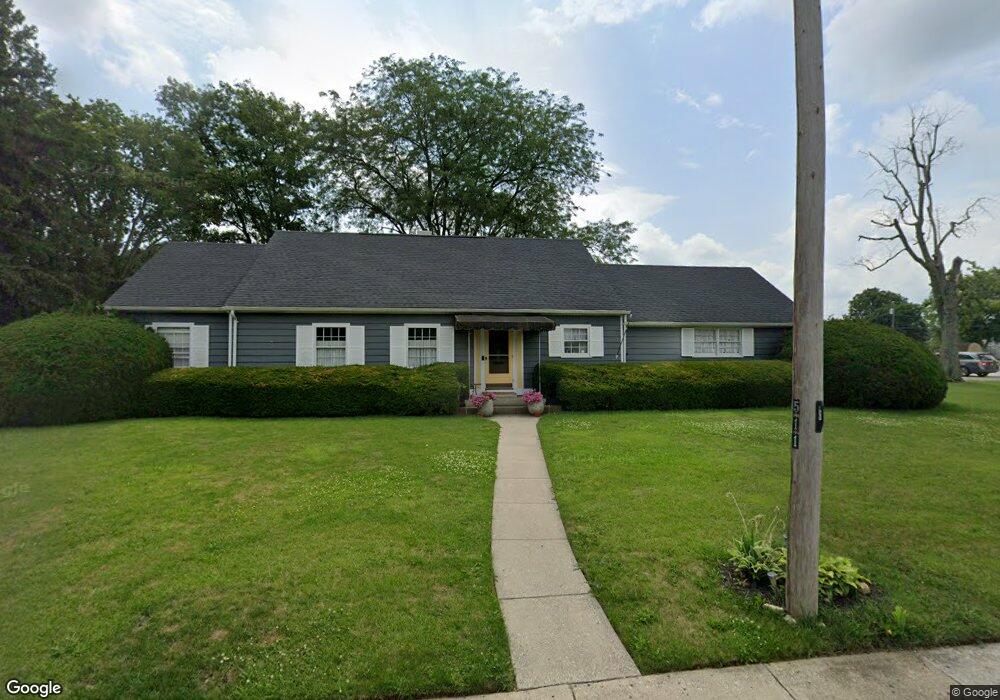
This home is located at 511 Gill St, Piqua, OH 45356 and is currently estimated at $245,243, approximately $124 per square foot. 511 Gill St is a home located in Miami County with nearby schools including Piqua Central Intermediate School, Springcreek Primary School, and Piqua Junior High School.
Ownership History
Date
Name
Owned For
Owner Type
Purchase Details
Closed on
Sep 2, 2021
Sold by
Mahrt John C and Mahrt Evelyn J
Bought by
Hinkle Michael Shane and Hinkle Amanda Sue
Current Estimated Value
Home Financials for this Owner
Home Financials are based on the most recent Mortgage that was taken out on this home.
Original Mortgage
$155,000
Outstanding Balance
$140,828
Interest Rate
2.7%
Mortgage Type
New Conventional
Estimated Equity
$104,415
Purchase Details
Closed on
Jan 1, 1990
Bought by
Gerhart Harriet E
Create a Home Valuation Report for This Property
The Home Valuation Report is an in-depth analysis detailing your home's value as well as a comparison with similar homes in the area
Home Values in the Area
Average Home Value in this Area
Purchase History
| Date | Buyer | Sale Price | Title Company |
|---|---|---|---|
| Hinkle Michael Shane | $185,500 | None Available | |
| Gerhart Harriet E | -- | -- |
Source: Public Records
Mortgage History
| Date | Status | Borrower | Loan Amount |
|---|---|---|---|
| Open | Hinkle Michael Shane | $155,000 |
Source: Public Records
Tax History
| Year | Tax Paid | Tax Assessment Tax Assessment Total Assessment is a certain percentage of the fair market value that is determined by local assessors to be the total taxable value of land and additions on the property. | Land | Improvement |
|---|---|---|---|---|
| 2024 | $2,807 | $58,700 | $16,490 | $42,210 |
| 2023 | $2,412 | $58,700 | $16,490 | $42,210 |
| 2022 | $2,454 | $58,700 | $16,490 | $42,210 |
| 2021 | $1,264 | $45,150 | $12,670 | $32,480 |
| 2020 | $1,239 | $45,150 | $12,670 | $32,480 |
| 2019 | $1,245 | $45,150 | $12,670 | $32,480 |
| 2018 | $892 | $36,400 | $13,160 | $23,240 |
| 2017 | $903 | $36,400 | $13,160 | $23,240 |
| 2016 | $1,306 | $36,400 | $13,160 | $23,240 |
| 2015 | $1,269 | $35,000 | $12,670 | $22,330 |
| 2014 | $1,269 | $35,000 | $12,670 | $22,330 |
| 2013 | $1,746 | $35,000 | $12,670 | $22,330 |
Source: Public Records
Map
Nearby Homes
- 505 Scott St
- 508 Park Ave
- 1307 Walker St
- 735 Park Ave
- 606 Boone St
- 630 Boone St
- 651 Boone St
- 1507 Nicklin Ave
- 1115 Madison Ave
- 522 W North St
- 1514 Nicklin Ave
- 614 Cherry St
- 502 Caldwell St
- 1516 Madison Ave
- 825 W Greene St
- 333 W Greene St
- 10175 Piqua Lockington Rd
- 615 N Wayne St
- 1062 Boone St
- 806 W High St
Your Personal Tour Guide
Ask me questions while you tour the home.