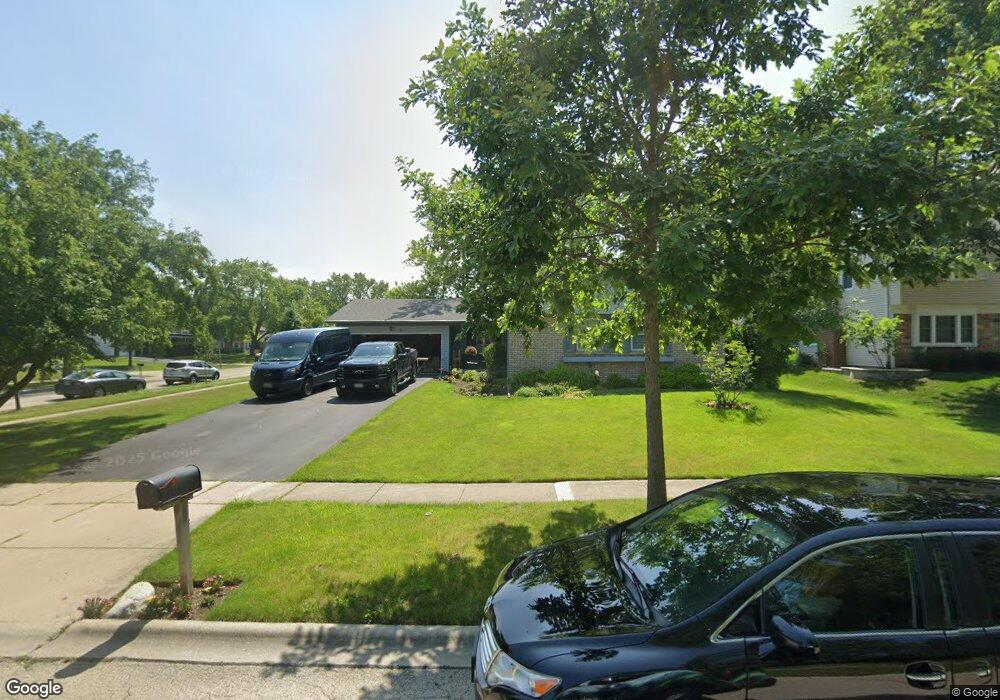
511 Indian Spring Ln Buffalo Grove, IL 60089
Estimated Value: $438,290 - $450,000
--
Bed
2
Baths
1,614
Sq Ft
$274/Sq Ft
Est. Value
About This Home
This home is located at 511 Indian Spring Ln, Buffalo Grove, IL 60089 and is currently estimated at $442,823, approximately $274 per square foot. 511 Indian Spring Ln is a home located in Lake County with nearby schools including Ivy Hall Elementary School, Twin Groves Middle School, and Adlai E Stevenson High School.
Ownership History
Date
Name
Owned For
Owner Type
Purchase Details
Closed on
May 9, 2024
Sold by
Mazursky Robert A and Mazursky Lauren E
Bought by
May Lauren and Mazursky Lauren
Current Estimated Value
Purchase Details
Closed on
Jun 22, 2022
Sold by
Mazursky Robert A and Mazursky Lauren E
Bought by
Mazursky Robert A and Mazursky Lauren E
Purchase Details
Closed on
Nov 22, 1999
Sold by
Glazer Belgrad Marc J and Glazer Belgrad Susan
Bought by
Mazursky Robert A and Mazursky Lauren E
Home Financials for this Owner
Home Financials are based on the most recent Mortgage that was taken out on this home.
Original Mortgage
$135,000
Interest Rate
7.7%
Purchase Details
Closed on
Oct 28, 1993
Sold by
Belgrad Marc J and Belgrad Susan G
Bought by
Glazer Belgrad Marc J and Glazer Belgrad Susan
Home Financials for this Owner
Home Financials are based on the most recent Mortgage that was taken out on this home.
Original Mortgage
$123,000
Interest Rate
7%
Create a Home Valuation Report for This Property
The Home Valuation Report is an in-depth analysis detailing your home's value as well as a comparison with similar homes in the area
Home Values in the Area
Average Home Value in this Area
Purchase History
| Date | Buyer | Sale Price | Title Company |
|---|---|---|---|
| May Lauren | -- | None Listed On Document | |
| Mazursky Robert A | -- | None Listed On Document | |
| Mazursky Robert A | $226,000 | -- | |
| Glazer Belgrad Marc J | -- | Ticor Title Insurance Compan |
Source: Public Records
Mortgage History
| Date | Status | Borrower | Loan Amount |
|---|---|---|---|
| Previous Owner | Mazursky Robert A | $135,000 | |
| Previous Owner | Glazer Belgrad Marc J | $123,000 |
Source: Public Records
Tax History Compared to Growth
Tax History
| Year | Tax Paid | Tax Assessment Tax Assessment Total Assessment is a certain percentage of the fair market value that is determined by local assessors to be the total taxable value of land and additions on the property. | Land | Improvement |
|---|---|---|---|---|
| 2024 | $11,510 | $127,392 | $35,577 | $91,815 |
| 2023 | $10,935 | $120,204 | $33,570 | $86,634 |
| 2022 | $10,935 | $110,868 | $30,963 | $79,905 |
| 2021 | $10,519 | $109,672 | $30,629 | $79,043 |
| 2020 | $10,272 | $110,046 | $30,733 | $79,313 |
| 2019 | $10,132 | $109,641 | $30,620 | $79,021 |
| 2018 | $9,496 | $106,266 | $30,262 | $76,004 |
| 2017 | $9,315 | $103,786 | $29,556 | $74,230 |
| 2016 | $9,067 | $99,383 | $28,302 | $71,081 |
| 2015 | $8,819 | $92,942 | $26,468 | $66,474 |
| 2014 | $8,152 | $85,204 | $28,426 | $56,778 |
| 2012 | $8,077 | $85,375 | $28,483 | $56,892 |
Source: Public Records
Map
Nearby Homes
- 390 Springside Ln
- 610 Checker Dr
- 800 Clohesey Dr
- 746 Old Checker Rd Unit E5
- 1112 Auburn Ln
- 711 Woodhollow Ln
- 412 Chateau Dr
- 931 Shady Grove Ln
- 950 Belmar Ln
- 12 Cloverdale Ct
- 887 Saybrook Ln Unit 2
- 1141 Devonshire Rd
- 98 Stonegate Rd
- 603 Cherbourg Ct N
- 1514 Sumter Dr
- 1325 Fairfax Ln
- 1324 Fairfax Ln Unit B32
- 1032 Courtland Dr Unit 9
- 1545 Chickamauga Ln
- 1265 Devonshire Rd
- 521 Indian Spring Ln
- 931 Twisted Oak Ln
- 941 Twisted Oak Ln
- 531 Indian Spring Ln
- 920 Dorncliff Ln
- 901 Dorncliff Ln Unit 6
- 910 Dorncliff Ln
- 951 Twisted Oak Ln
- 900 Dorncliff Ln
- 930 Dorncliff Ln
- 920 Westbourne Ln
- 541 Indian Spring Ln Unit 6
- 890 Dorncliff Ln
- 891 Dorncliff Ln
- 961 Twisted Oak Ln
- 911 Twisted Oak Ln
- 910 Westbourne Ln
- 891 Twisted Oak Ln
- 958 Twisted Oak Ln
- 966 Twisted Oak Ln