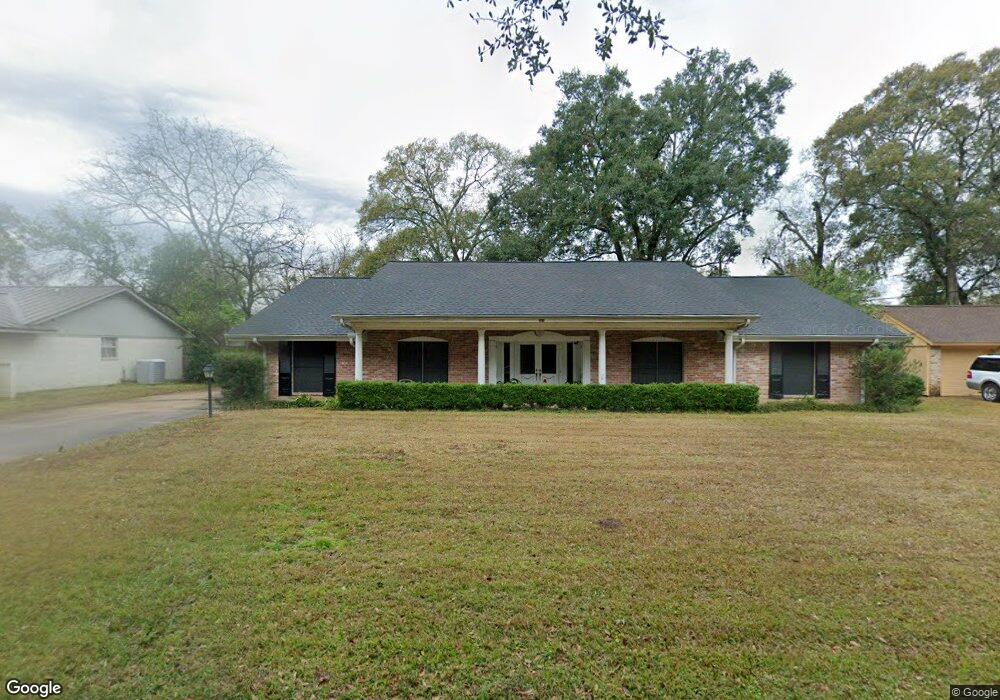
511 Inwood Dr Tomball, TX 77375
Estimated Value: $379,886 - $416,000
3
Beds
2
Baths
2,661
Sq Ft
$150/Sq Ft
Est. Value
About This Home
This home is located at 511 Inwood Dr, Tomball, TX 77375 and is currently estimated at $399,722, approximately $150 per square foot. 511 Inwood Dr is a home located in Harris County with nearby schools including Tomball Elementary School, Tomball Intermediate School, and Tomball Junior High School.
Ownership History
Date
Name
Owned For
Owner Type
Purchase Details
Closed on
Aug 2, 2005
Sold by
Brown Robert R and Estate Of Pauline Minton Carte
Bought by
Husbands Jacqueline
Current Estimated Value
Home Financials for this Owner
Home Financials are based on the most recent Mortgage that was taken out on this home.
Original Mortgage
$120,000
Outstanding Balance
$62,591
Interest Rate
5.55%
Mortgage Type
Fannie Mae Freddie Mac
Estimated Equity
$337,131
Create a Home Valuation Report for This Property
The Home Valuation Report is an in-depth analysis detailing your home's value as well as a comparison with similar homes in the area
Home Values in the Area
Average Home Value in this Area
Purchase History
| Date | Buyer | Sale Price | Title Company |
|---|---|---|---|
| Husbands Jacqueline | -- | Stewart Title Houston Div |
Source: Public Records
Mortgage History
| Date | Status | Borrower | Loan Amount |
|---|---|---|---|
| Open | Husbands Jacqueline | $120,000 |
Source: Public Records
Tax History Compared to Growth
Tax History
| Year | Tax Paid | Tax Assessment Tax Assessment Total Assessment is a certain percentage of the fair market value that is determined by local assessors to be the total taxable value of land and additions on the property. | Land | Improvement |
|---|---|---|---|---|
| 2025 | $5,175 | $312,887 | $98,817 | $214,070 |
| 2024 | $5,175 | $312,887 | $98,817 | $214,070 |
| 2023 | $5,175 | $312,887 | $98,817 | $214,070 |
| 2022 | $5,579 | $273,362 | $57,736 | $215,626 |
| 2021 | $5,336 | $225,000 | $44,412 | $180,588 |
| 2020 | $5,518 | $225,000 | $44,412 | $180,588 |
| 2019 | $5,647 | $225,042 | $44,412 | $180,630 |
| 2018 | $2,392 | $239,500 | $31,088 | $208,412 |
| 2017 | $4,662 | $185,000 | $31,088 | $153,912 |
| 2016 | $4,662 | $185,000 | $31,088 | $153,912 |
| 2015 | $1,964 | $222,283 | $31,088 | $191,195 |
| 2014 | $1,964 | $189,833 | $31,088 | $158,745 |
Source: Public Records
Map
Nearby Homes
- 20734 Open Range Ct
- 18818 Cornelia Fields Ln
- 18723 Buttercup Farms Ln
- 20718 Open Range Ct
- 19951 Epona Creek Dr
- 19935 Epona Creek Dr
- 18707 Buttercup Farms Ln
- 20710 Open Range Ct
- 18826 Cornelia Fields Ln
- 20714 Open Range Ct
- 504 Percival St Unit A
- 0 N Sycamore St
- 204 Vernon St
- 1126 Audrey Trail
- 200 S Vernon St
- 505 Percival St
- 516 Clayton St
- TBD Clayton St
- 16623 Farm To Market 2920
- 0 Fm-2920