511 K St Penrose, CO 81240
Estimated Value: $336,000 - $427,000
3
Beds
2
Baths
1,782
Sq Ft
$209/Sq Ft
Est. Value
About This Home
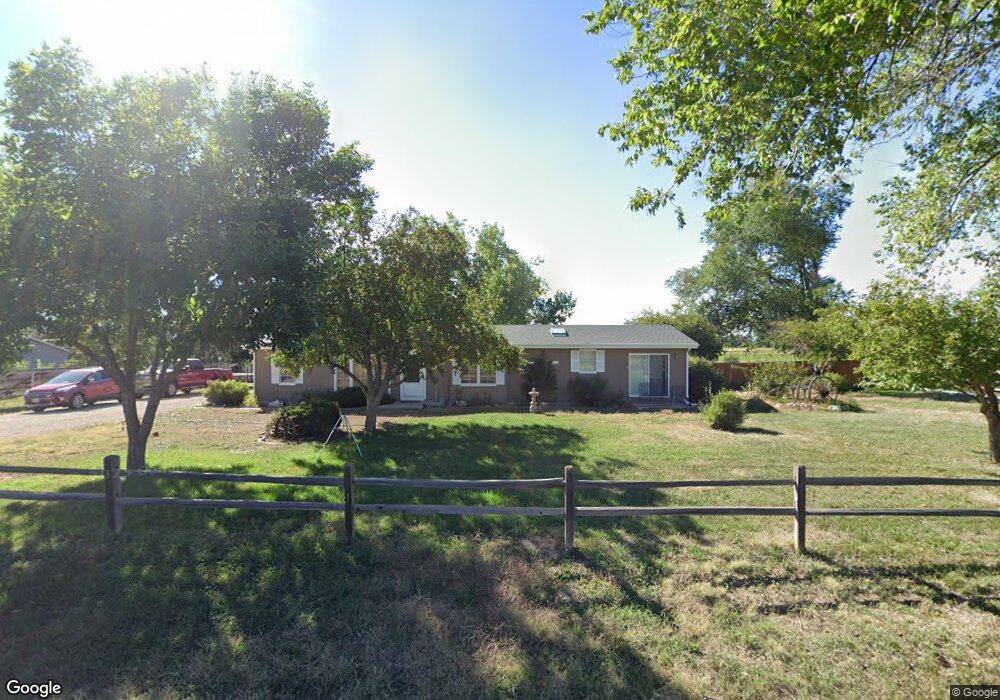
This home is located at 511 K St, Penrose, CO 81240 and is currently estimated at $372,000, approximately $208 per square foot. 511 K St is a home located in Fremont County with nearby schools including Penrose Elementary School and Florence High School.
Ownership History
Date
Name
Owned For
Owner Type
Purchase Details
Closed on
Apr 20, 2017
Sold by
Rawlins Carri
Bought by
Rawlins Carri L and Rawlins Jimmy L
Current Estimated Value
Home Financials for this Owner
Home Financials are based on the most recent Mortgage that was taken out on this home.
Original Mortgage
$125,406
Outstanding Balance
$103,371
Interest Rate
3.87%
Mortgage Type
FHA
Estimated Equity
$268,629
Purchase Details
Closed on
Mar 22, 2016
Sold by
Federal National Mortgage Association
Bought by
Rawlins Carrie
Purchase Details
Closed on
Feb 4, 2016
Sold by
Mitchell Paula
Bought by
Cit Bank Na
Purchase Details
Closed on
Jan 29, 2015
Sold by
Cit Bank Na
Bought by
Fannie Mae
Create a Home Valuation Report for This Property
The Home Valuation Report is an in-depth analysis detailing your home's value as well as a comparison with similar homes in the area
Home Values in the Area
Average Home Value in this Area
Purchase History
| Date | Buyer | Sale Price | Title Company |
|---|---|---|---|
| Rawlins Carri L | -- | Land Title Guarantee Company | |
| Rawlins Carrie | $141,669 | None Available | |
| Cit Bank Na | -- | None Available | |
| Fannie Mae | -- | None Available |
Source: Public Records
Mortgage History
| Date | Status | Borrower | Loan Amount |
|---|---|---|---|
| Open | Rawlins Carri L | $125,406 |
Source: Public Records
Tax History Compared to Growth
Tax History
| Year | Tax Paid | Tax Assessment Tax Assessment Total Assessment is a certain percentage of the fair market value that is determined by local assessors to be the total taxable value of land and additions on the property. | Land | Improvement |
|---|---|---|---|---|
| 2024 | $1,044 | $18,187 | $0 | $0 |
| 2023 | $1,044 | $14,167 | $0 | $0 |
| 2022 | $1,019 | $13,970 | $0 | $0 |
| 2021 | $1,031 | $14,372 | $0 | $0 |
| 2020 | $688 | $11,196 | $0 | $0 |
| 2019 | $682 | $11,040 | $0 | $0 |
| 2018 | $553 | $8,973 | $0 | $0 |
| 2017 | $563 | $8,973 | $0 | $0 |
| 2016 | $600 | $9,720 | $0 | $0 |
| 2015 | $593 | $9,720 | $0 | $0 |
| 2012 | $607 | $9,185 | $2,786 | $6,399 |
Source: Public Records
Map
Nearby Homes