Estimated Value: $892,000 - $978,000
4
Beds
3
Baths
2,453
Sq Ft
$386/Sq Ft
Est. Value
About This Home
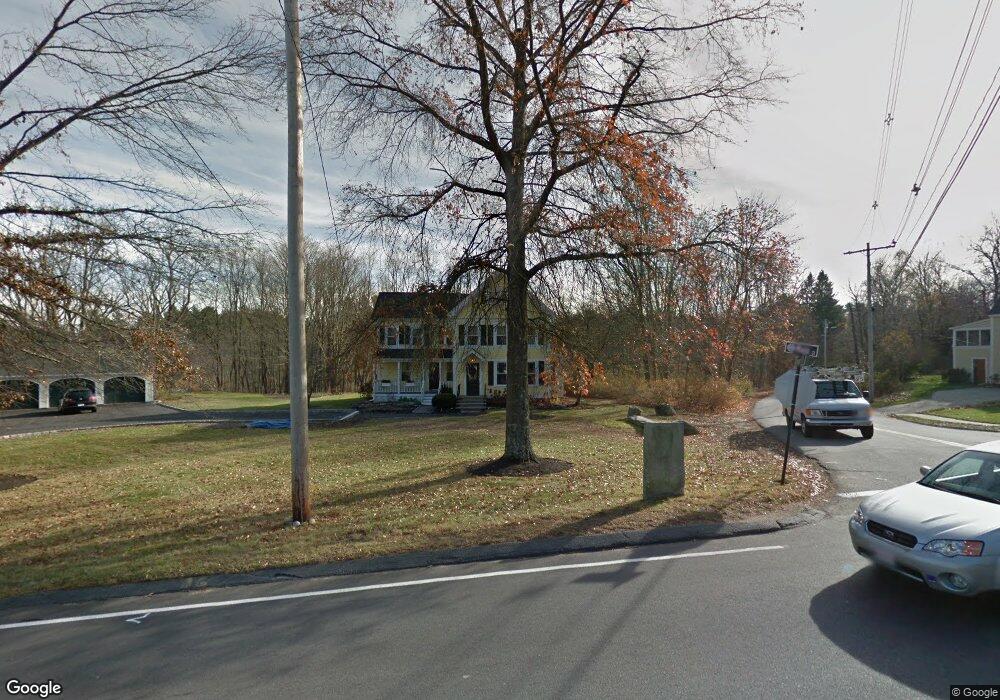
This home is located at 511 Main St, Acton, MA 01720 and is currently estimated at $946,135, approximately $385 per square foot. 511 Main St is a home located in Middlesex County with nearby schools including Acton-Boxborough Regional High School and Oak Meadow Montessori School.
Ownership History
Date
Name
Owned For
Owner Type
Purchase Details
Closed on
Nov 30, 2011
Sold by
Pell Thomas B and Pell Leigh S
Bought by
Oconnor Jason B and Oconnor Jennifer A
Current Estimated Value
Home Financials for this Owner
Home Financials are based on the most recent Mortgage that was taken out on this home.
Original Mortgage
$468,000
Outstanding Balance
$319,194
Interest Rate
4.1%
Mortgage Type
Purchase Money Mortgage
Estimated Equity
$626,941
Purchase Details
Closed on
Jul 17, 1991
Sold by
Mcclain David S
Bought by
Bell Thomas B and Bell Leigh S
Home Financials for this Owner
Home Financials are based on the most recent Mortgage that was taken out on this home.
Original Mortgage
$191,250
Interest Rate
9.36%
Mortgage Type
Purchase Money Mortgage
Create a Home Valuation Report for This Property
The Home Valuation Report is an in-depth analysis detailing your home's value as well as a comparison with similar homes in the area
Home Values in the Area
Average Home Value in this Area
Purchase History
| Date | Buyer | Sale Price | Title Company |
|---|---|---|---|
| Oconnor Jason B | $520,000 | -- | |
| Bell Thomas B | $265,000 | -- |
Source: Public Records
Mortgage History
| Date | Status | Borrower | Loan Amount |
|---|---|---|---|
| Open | Oconnor Jason B | $468,000 | |
| Previous Owner | Bell Thomas B | $227,000 | |
| Previous Owner | Bell Thomas B | $220,000 | |
| Previous Owner | Bell Thomas B | $191,250 |
Source: Public Records
Tax History
| Year | Tax Paid | Tax Assessment Tax Assessment Total Assessment is a certain percentage of the fair market value that is determined by local assessors to be the total taxable value of land and additions on the property. | Land | Improvement |
|---|---|---|---|---|
| 2025 | $14,008 | $816,800 | $366,900 | $449,900 |
| 2024 | $13,149 | $788,800 | $366,900 | $421,900 |
| 2023 | $12,821 | $730,100 | $334,000 | $396,100 |
| 2022 | $12,205 | $627,500 | $291,600 | $335,900 |
| 2021 | $11,926 | $589,500 | $270,800 | $318,700 |
| 2020 | $11,259 | $585,200 | $270,800 | $314,400 |
| 2019 | $10,677 | $551,200 | $270,800 | $280,400 |
| 2018 | $10,518 | $542,700 | $270,800 | $271,900 |
| 2017 | $10,262 | $538,400 | $270,800 | $267,600 |
| 2016 | $10,109 | $525,700 | $270,800 | $254,900 |
| 2015 | $9,923 | $520,900 | $270,800 | $250,100 |
| 2014 | $9,678 | $497,600 | $270,800 | $226,800 |
Source: Public Records
Map
Nearby Homes
- 491 Main St
- 709 Main St
- 33 Meadowbrook Rd
- 524 Main St
- 11 Braebrook
- 46 Taylor Rd
- 27 Forest Rd
- 95 Concord Rd
- 18 Hayward Rd
- 15 Davis Rd Unit B-8
- 11 Davis Rd Unit A5
- 11 Davis Rd Unit B8
- 1 Bayberry Rd
- 134 Pope Rd
- 79 Charter Rd
- 380 Great Rd Unit B301
- 380A Great Rd Unit 301
- 159 Skyline Dr Unit 159
- 388 Great Rd Unit A9
- 388 Great Rd Unit B14
Your Personal Tour Guide
Ask me questions while you tour the home.