Estimated Value: $118,000 - $275,282
Studio
--
Bath
1,104
Sq Ft
$198/Sq Ft
Est. Value
About This Home
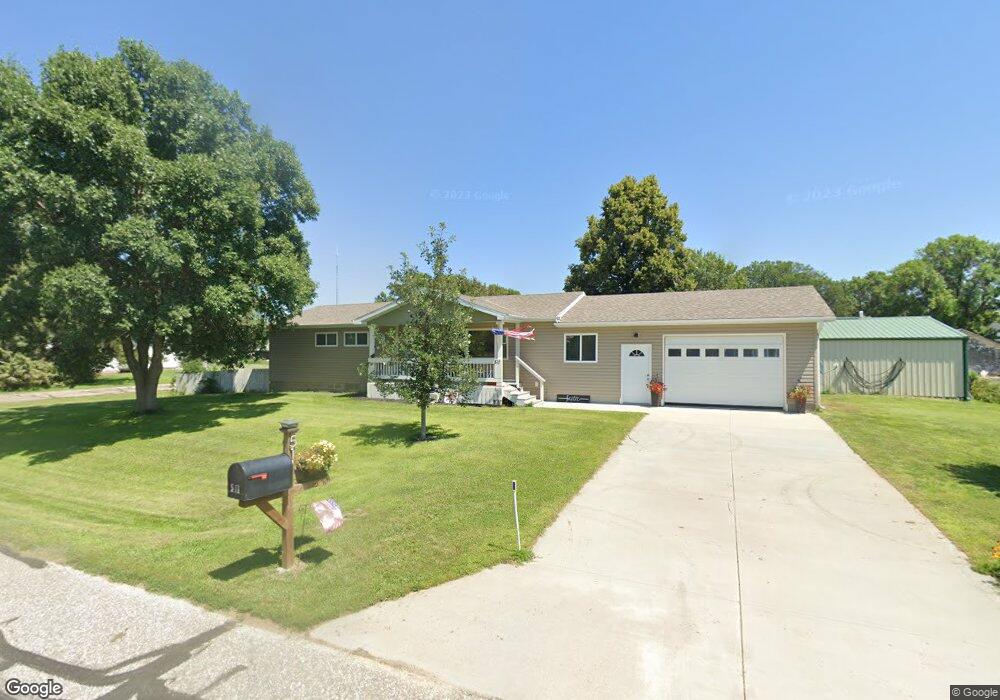
This home is located at 511 Main St, Funk, NE 68940 and is currently estimated at $218,071, approximately $197 per square foot. 511 Main St is a home located in Phelps County with nearby schools including Holdrege Elementary School, Holdrege Middle School, and Holdrege High School.
Ownership History
Date
Name
Owned For
Owner Type
Purchase Details
Closed on
Jul 25, 2024
Sold by
Shultz Payton and Shultz Isabel
Bought by
Martindale Mark E and Martindale Doris M
Current Estimated Value
Purchase Details
Closed on
Sep 29, 2008
Sold by
Indymac Federal Bank Fsb
Bought by
Martindale Mark E and Martindale Doris M
Home Financials for this Owner
Home Financials are based on the most recent Mortgage that was taken out on this home.
Original Mortgage
$36,086
Interest Rate
5.99%
Mortgage Type
Future Advance Clause Open End Mortgage
Create a Home Valuation Report for This Property
The Home Valuation Report is an in-depth analysis detailing your home's value as well as a comparison with similar homes in the area
Purchase History
| Date | Buyer | Sale Price | Title Company |
|---|---|---|---|
| Martindale Mark E | $4,000 | Phelps County Title | |
| Martindale Mark E | $45,000 | -- |
Source: Public Records
Mortgage History
| Date | Status | Borrower | Loan Amount |
|---|---|---|---|
| Previous Owner | Martindale Mark E | $36,086 |
Source: Public Records
Tax History
| Year | Tax Paid | Tax Assessment Tax Assessment Total Assessment is a certain percentage of the fair market value that is determined by local assessors to be the total taxable value of land and additions on the property. | Land | Improvement |
|---|---|---|---|---|
| 2025 | $2,097 | $243,335 | $15,470 | $227,865 |
| 2024 | $1,868 | $194,860 | $15,470 | $179,390 |
| 2023 | $2,453 | $191,815 | $12,425 | $179,390 |
| 2022 | $2,508 | $188,315 | $8,925 | $179,390 |
| 2021 | $1,788 | $139,575 | $8,925 | $130,650 |
| 2020 | $1,727 | $139,575 | $8,925 | $130,650 |
| 2019 | $1,456 | $125,955 | $8,925 | $117,030 |
| 2018 | $1,362 | $125,955 | $8,925 | $117,030 |
| 2017 | $1,246 | $117,370 | $6,070 | $111,300 |
| 2016 | $1,233 | $98,455 | $6,070 | $92,385 |
| 2015 | $1,095 | $98,455 | $6,070 | $92,385 |
| 2014 | $1,219 | $79,935 | $6,070 | $73,865 |
| 2013 | $1,219 | $79,935 | $6,070 | $73,865 |
Source: Public Records
Map
Nearby Homes
- 0000 Polyline Rd
- 1313 Pamela Ave
- 824 Sherman St
- 915 Sherman St
- 722 Logan St
- 816 Garfield St
- 1305 East Ave
- 1010 East Ave
- 501 A Ave
- 1023 Tilden St
- 1023 Hancock St
- 73803 Highway 183
- L1B2 Craneview 3rd Subdivison
- 815 Tibbals St
- 117 W 3rd Ave
- 1306 Maberly St
- 901 Maberly St
- Lot 4 Block 3 Quail Run
- Lot 3 Block 3 Quail Run
- Lot 2 Block 3 Quail Run
Your Personal Tour Guide
Ask me questions while you tour the home.