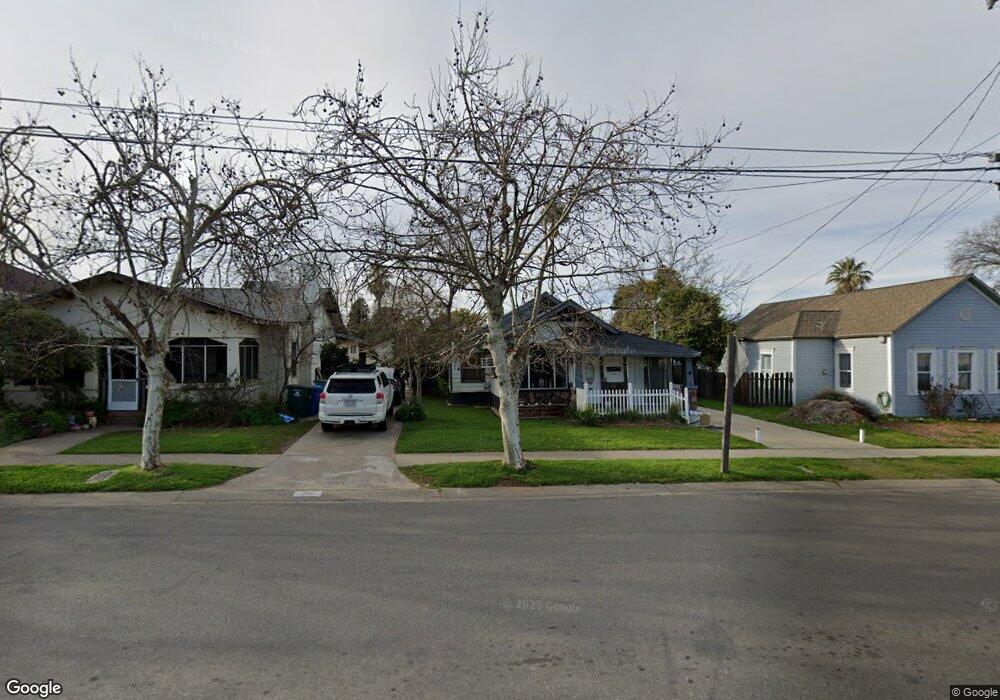
511 Main St Wheatland, CA 95692
Estimated Value: $216,000 - $277,730
3
Beds
1
Bath
1,062
Sq Ft
$243/Sq Ft
Est. Value
About This Home
This home is located at 511 Main St, Wheatland, CA 95692 and is currently estimated at $258,183, approximately $243 per square foot. 511 Main St is a home located in Yuba County with nearby schools including Wheatland Elementary School, Bear River, and Wheatland Union High School.
Ownership History
Date
Name
Owned For
Owner Type
Purchase Details
Closed on
Jan 11, 2010
Sold by
Fisher Michael
Bought by
Fisher Michael J
Current Estimated Value
Home Financials for this Owner
Home Financials are based on the most recent Mortgage that was taken out on this home.
Original Mortgage
$25,000
Outstanding Balance
$16,332
Interest Rate
5.01%
Mortgage Type
New Conventional
Estimated Equity
$241,851
Purchase Details
Closed on
Nov 19, 2009
Sold by
Aurora Loan Services Llc
Bought by
Fisher Michael
Home Financials for this Owner
Home Financials are based on the most recent Mortgage that was taken out on this home.
Original Mortgage
$25,000
Outstanding Balance
$16,332
Interest Rate
5.01%
Mortgage Type
New Conventional
Estimated Equity
$241,851
Purchase Details
Closed on
Jun 19, 2009
Sold by
Bendure Bob N
Bought by
Aurora Loan Services Llc
Create a Home Valuation Report for This Property
The Home Valuation Report is an in-depth analysis detailing your home's value as well as a comparison with similar homes in the area
Home Values in the Area
Average Home Value in this Area
Purchase History
| Date | Buyer | Sale Price | Title Company |
|---|---|---|---|
| Fisher Michael J | -- | None Available | |
| Fisher Michael | $69,000 | North American Title Company | |
| Aurora Loan Services Llc | $233,029 | Servicelink |
Source: Public Records
Mortgage History
| Date | Status | Borrower | Loan Amount |
|---|---|---|---|
| Open | Fisher Michael | $25,000 |
Source: Public Records
Tax History
| Year | Tax Paid | Tax Assessment Tax Assessment Total Assessment is a certain percentage of the fair market value that is determined by local assessors to be the total taxable value of land and additions on the property. | Land | Improvement |
|---|---|---|---|---|
| 2025 | $991 | $89,050 | $25,809 | $63,241 |
| 2023 | $991 | $85,593 | $24,807 | $60,786 |
| 2022 | $954 | $83,916 | $24,321 | $59,595 |
| 2021 | $878 | $82,272 | $23,845 | $58,427 |
| 2020 | $864 | $81,429 | $23,601 | $57,828 |
| 2019 | $848 | $79,834 | $23,139 | $56,695 |
| 2018 | $831 | $78,270 | $22,686 | $55,584 |
| 2017 | $803 | $76,737 | $22,242 | $54,495 |
| 2016 | $792 | $75,233 | $21,806 | $53,427 |
| 2015 | $778 | $74,104 | $21,479 | $52,625 |
| 2014 | $761 | $72,654 | $21,059 | $51,595 |
Source: Public Records
Map
Nearby Homes
- 404 Mesa St
- 280 G St
- 213 Main St
- 2021 California 65
- 606 Nightingale Way
- 607 Stineman Ct
- 729 Spruce Ave
- 1101 Elm Terrace Way
- 1104 Elm Terrace Way
- 1120 Cedar Dr
- 1216 Havenwood Way
- 2036 Lewis Rd
- 1124 Elm Terrace Way
- 4551 Wheatland Rd
- 2434 Spenceville Rd
- 2636 Spenceville Rd
- 1745 Oakley
- 2756 Spenceville Rd
- 2947 S Beale Rd
- 4390 Rolling Hills Rd
Your Personal Tour Guide
Ask me questions while you tour the home.