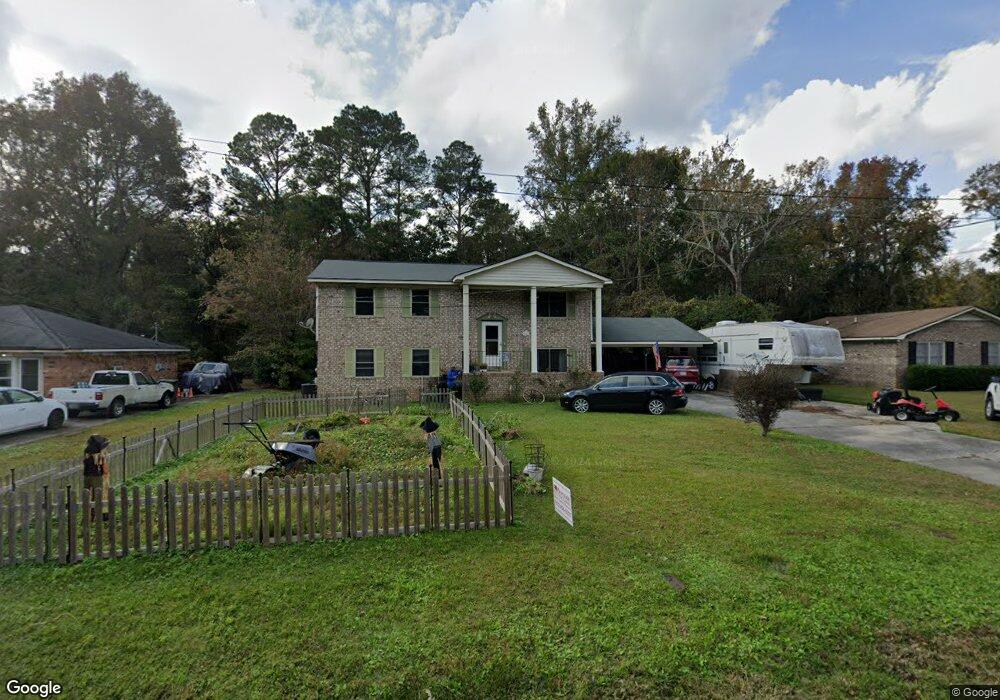
511 Myrtle Ln Hinesville, GA 31313
Estimated Value: $228,000 - $276,000
4
Beds
2
Baths
2,000
Sq Ft
$124/Sq Ft
Est. Value
About This Home
This home is located at 511 Myrtle Ln, Hinesville, GA 31313 and is currently estimated at $248,378, approximately $124 per square foot. 511 Myrtle Ln is a home located in Liberty County with nearby schools including Joseph Martin Elementary School, Midway Middle School, and Liberty County High School.
Ownership History
Date
Name
Owned For
Owner Type
Purchase Details
Closed on
Sep 14, 2015
Sold by
Morales Jessica L
Bought by
Morales Mike G
Current Estimated Value
Purchase Details
Closed on
Jun 28, 2006
Sold by
Twyeffort Kevin W
Bought by
Morales Mike G and Morales Jessica L
Home Financials for this Owner
Home Financials are based on the most recent Mortgage that was taken out on this home.
Original Mortgage
$140,488
Interest Rate
6.6%
Mortgage Type
VA
Purchase Details
Closed on
May 29, 2003
Sold by
Cade Dawn
Bought by
Twyeffort Kevin W
Purchase Details
Closed on
Jul 7, 1999
Sold by
Cade Charles R and Cade Daw
Bought by
Cade Dawn
Purchase Details
Closed on
Aug 24, 1995
Bought by
Cade Charles R and Cade Daw
Purchase Details
Closed on
May 30, 1975
Bought by
Smith Andrew J
Create a Home Valuation Report for This Property
The Home Valuation Report is an in-depth analysis detailing your home's value as well as a comparison with similar homes in the area
Home Values in the Area
Average Home Value in this Area
Purchase History
| Date | Buyer | Sale Price | Title Company |
|---|---|---|---|
| Morales Mike G | -- | -- | |
| Morales Mike G | $136,000 | -- | |
| Twyeffort Kevin W | $96,500 | -- | |
| Cade Dawn | -- | -- | |
| Cade Charles R | $79,900 | -- | |
| Smith Andrew J | $37,000 | -- |
Source: Public Records
Mortgage History
| Date | Status | Borrower | Loan Amount |
|---|---|---|---|
| Previous Owner | Morales Mike G | $140,488 |
Source: Public Records
Tax History Compared to Growth
Tax History
| Year | Tax Paid | Tax Assessment Tax Assessment Total Assessment is a certain percentage of the fair market value that is determined by local assessors to be the total taxable value of land and additions on the property. | Land | Improvement |
|---|---|---|---|---|
| 2024 | $3,411 | $69,414 | $8,000 | $61,414 |
| 2023 | $3,411 | $61,218 | $8,000 | $53,218 |
| 2022 | $22 | $51,593 | $8,000 | $43,593 |
| 2021 | $22 | $46,935 | $8,000 | $38,935 |
| 2020 | $21 | $46,935 | $8,000 | $38,935 |
| 2019 | $21 | $47,454 | $8,000 | $39,454 |
| 2018 | $21 | $47,454 | $8,000 | $39,454 |
| 2017 | $1,389 | $42,192 | $8,000 | $34,192 |
| 2016 | $1,928 | $42,703 | $8,000 | $34,703 |
| 2015 | $2,039 | $42,703 | $8,000 | $34,703 |
| 2014 | $2,039 | $44,698 | $8,000 | $36,698 |
| 2013 | -- | $44,949 | $8,000 | $36,949 |
Source: Public Records
Map
Nearby Homes
- 506 Eisenhower Dr
- 405 Patton Rd
- 514 Creekview Dr
- 601 Heritage Dr
- 606 Heritage Dr
- 412 Timberlane Cir
- 402 W Oglethorpe Hwy
- 601 Tupelo Trail Unit 42
- 1 Oglethorpe Ave
- 996 Stone Ct
- 709 Eden Ln
- 1316 Hill View Cir
- 420 Club Dr
- 148 Marron Way
- 76 Boundary Hal Way
- 12 Boundary Hal Way
- 480 Dykes St
- 980 Grayson Ave
- 1078 Grayson Ave