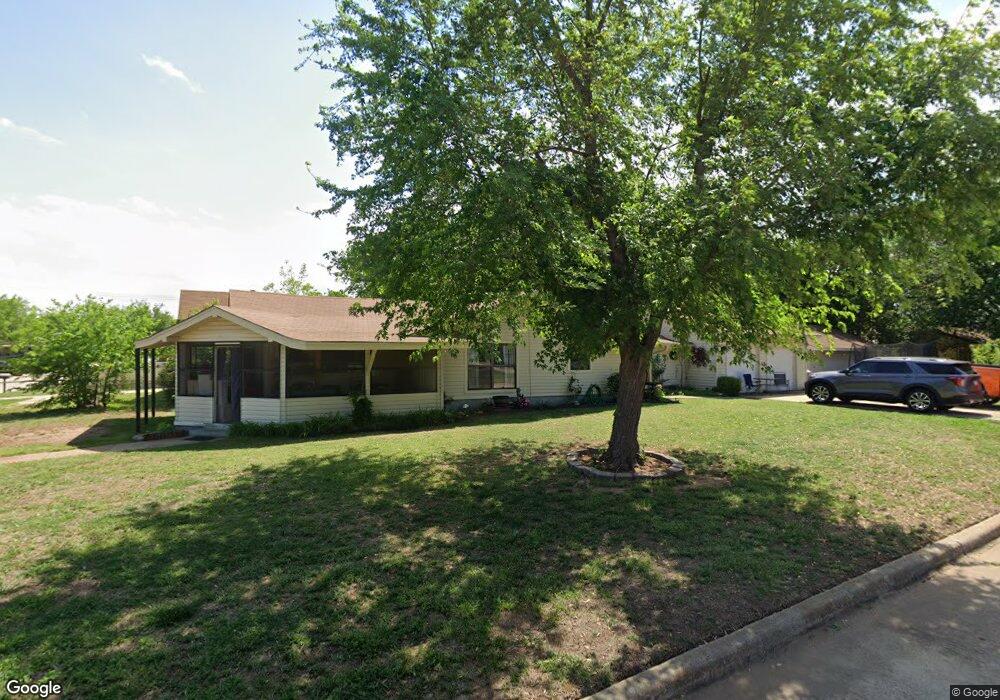
511 N 13th St Duncan, OK 73533
Estimated Value: $63,000 - $100,281
2
Beds
1
Bath
1,515
Sq Ft
$58/Sq Ft
Est. Value
About This Home
This home is located at 511 N 13th St, Duncan, OK 73533 and is currently estimated at $87,320, approximately $57 per square foot. 511 N 13th St is a home located in Stephens County with nearby schools including Emerson Elementary School, Duncan Middle School, and Duncan High School.
Ownership History
Date
Name
Owned For
Owner Type
Purchase Details
Closed on
Jun 15, 2021
Sold by
Bettencourt Christina and Brown Christina M
Bought by
Brown Christina M and Brown Nathan H
Current Estimated Value
Home Financials for this Owner
Home Financials are based on the most recent Mortgage that was taken out on this home.
Original Mortgage
$69,400
Outstanding Balance
$62,756
Interest Rate
2.96%
Mortgage Type
New Conventional
Estimated Equity
$24,564
Purchase Details
Closed on
Apr 23, 2007
Sold by
Bettencourt Sean M
Bought by
Bettencourt Christina
Purchase Details
Closed on
May 17, 2004
Sold by
Charles Charles E and Charles F
Purchase Details
Closed on
Nov 14, 2003
Sold by
Willhite Charles E
Purchase Details
Closed on
Jun 24, 1999
Sold by
Willhite Charles E
Create a Home Valuation Report for This Property
The Home Valuation Report is an in-depth analysis detailing your home's value as well as a comparison with similar homes in the area
Home Values in the Area
Average Home Value in this Area
Purchase History
| Date | Buyer | Sale Price | Title Company |
|---|---|---|---|
| Brown Christina M | -- | Solidifi Title Agency Llc | |
| Bettencourt Christina | -- | Title 68 | |
| -- | $52,000 | -- | |
| -- | -- | -- | |
| -- | -- | -- |
Source: Public Records
Mortgage History
| Date | Status | Borrower | Loan Amount |
|---|---|---|---|
| Open | Brown Christina M | $69,400 |
Source: Public Records
Tax History Compared to Growth
Tax History
| Year | Tax Paid | Tax Assessment Tax Assessment Total Assessment is a certain percentage of the fair market value that is determined by local assessors to be the total taxable value of land and additions on the property. | Land | Improvement |
|---|---|---|---|---|
| 2025 | $569 | $7,748 | $515 | $7,233 |
| 2024 | $556 | $7,522 | $515 | $7,007 |
| 2023 | $556 | $7,522 | $515 | $7,007 |
| 2022 | $518 | $7,303 | $515 | $6,788 |
| 2021 | $518 | $7,090 | $515 | $6,575 |
| 2020 | $491 | $6,683 | $515 | $6,168 |
| 2019 | $475 | $6,489 | $515 | $5,974 |
| 2018 | $504 | $6,659 | $515 | $6,144 |
| 2017 | $486 | $6,659 | $515 | $6,144 |
| 2016 | $477 | $6,614 | $515 | $6,099 |
| 2015 | $495 | $6,614 | $515 | $6,099 |
| 2014 | $495 | $6,476 | $550 | $5,926 |
Source: Public Records
Map
Nearby Homes
- 1309 W Beech Ave
- 1116 1116 W Chestnut
- 1213 W Pine Ave
- 1105 W Beech Ave
- 815 N 14th St
- 810 810 N 12th St
- 812 N 15th St
- 1203 W Walnut Ave
- 27 N 14th St
- 1105 N Grand Blvd
- 1114 N 13th St
- 1001 1001 W Hackberry
- 1112 1112 N 12th
- 174831 N 2844 Rd
- 1202 N Grand Blvd
- 1099 N 19th St
- 1807 W Chisholm Dr
- 2006 W Oak Ave
- 2011 2011 W Oak Ave
- 273787 E 1720 Rd
- 509 N 13th St
- 507 N 13th St
- 1304 W Hickory Ave
- 505 N 13th St
- 601 N 13th St
- 1306 W Hickory Ave
- 503 N 13th St
- 1307 W Hickory Ave
- 1310 W Hickory Ave
- 1303 W Chestnut Ave
- 605 N 13th St
- 1305 W Chestnut Ave
- 602 N 13th St
- 501 N 13th St
- 1311 W Hickory Ave
- 1307 W Chestnut Ave
- 1316 W Hickory Ave
- 607 N 13th St
- 1307 1307 W Chestnut Ave
- 606 N 13th St