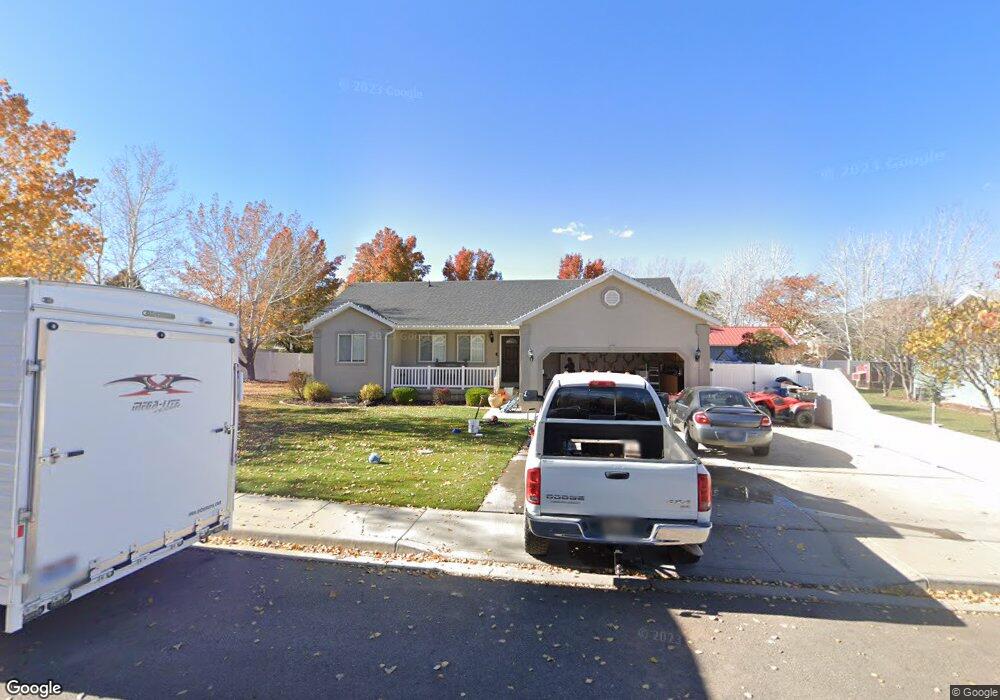
511 N 350 W Santaquin, UT 84655
Estimated Value: $448,927 - $462,000
3
Beds
2
Baths
2,334
Sq Ft
$196/Sq Ft
Est. Value
About This Home
This home is located at 511 N 350 W, Santaquin, UT 84655 and is currently estimated at $456,732, approximately $195 per square foot. 511 N 350 W is a home located in Utah County with nearby schools including Apple Valley Elementary, Payson Junior High School, and Payson High School.
Ownership History
Date
Name
Owned For
Owner Type
Purchase Details
Closed on
Apr 7, 2021
Sold by
Backus Jessie L and Backus Crista K
Bought by
Backus Jessie L and Backus Crista K
Current Estimated Value
Home Financials for this Owner
Home Financials are based on the most recent Mortgage that was taken out on this home.
Original Mortgage
$76,900
Outstanding Balance
$69,319
Interest Rate
2.9%
Mortgage Type
Purchase Money Mortgage
Estimated Equity
$387,413
Purchase Details
Closed on
Dec 30, 2002
Sold by
Mt Merrill Construction Inc
Bought by
Backus Jessie L and Backus Crista K
Home Financials for this Owner
Home Financials are based on the most recent Mortgage that was taken out on this home.
Original Mortgage
$126,266
Interest Rate
5.86%
Mortgage Type
FHA
Purchase Details
Closed on
Sep 6, 2002
Sold by
Beehive Meadows Llc
Bought by
Mt Merrill Construction Inc
Create a Home Valuation Report for This Property
The Home Valuation Report is an in-depth analysis detailing your home's value as well as a comparison with similar homes in the area
Home Values in the Area
Average Home Value in this Area
Purchase History
| Date | Buyer | Sale Price | Title Company |
|---|---|---|---|
| Backus Jessie L | -- | Juab Title & Abstract Co | |
| Backus Jessie L | -- | First American Title Co | |
| Mt Merrill Construction Inc | -- | Fidelity Land & Title |
Source: Public Records
Mortgage History
| Date | Status | Borrower | Loan Amount |
|---|---|---|---|
| Open | Backus Jessie L | $76,900 | |
| Closed | Backus Jessie L | $126,266 |
Source: Public Records
Tax History Compared to Growth
Tax History
| Year | Tax Paid | Tax Assessment Tax Assessment Total Assessment is a certain percentage of the fair market value that is determined by local assessors to be the total taxable value of land and additions on the property. | Land | Improvement |
|---|---|---|---|---|
| 2025 | $2,015 | $224,730 | $140,300 | $268,300 |
| 2024 | $2,015 | $200,640 | $0 | $0 |
| 2023 | $2,061 | $205,920 | $0 | $0 |
| 2022 | $2,204 | $227,150 | $0 | $0 |
| 2021 | $1,883 | $300,700 | $79,100 | $221,600 |
| 2020 | $1,808 | $279,800 | $68,800 | $211,000 |
| 2019 | $1,621 | $256,500 | $68,800 | $187,700 |
| 2018 | $1,491 | $225,000 | $60,100 | $164,900 |
| 2017 | $1,414 | $114,015 | $0 | $0 |
| 2016 | $1,327 | $104,885 | $0 | $0 |
| 2015 | $1,220 | $94,545 | $0 | $0 |
| 2014 | $1,138 | $88,000 | $0 | $0 |
Source: Public Records
Map
Nearby Homes
- 369 N 500 W Unit 3
- 162 W 690 N
- 600 N Center St
- Pendleton Plan at Silver Oaks
- 685 Empress St Unit 79
- 689 Empress St Unit 78
- 921 N 160 E
- 921 N 160 E Unit 12
- 931 N 160 E Unit 11
- 41 W 770 N
- 922 N 160 E Unit 20
- 932 N 160 E Unit 21
- 263 N Polly Ln
- 263 Polly Ln Unit 8
- 259 N Polly Ln
- 259 N Polly Ln Unit 7
- 255 Polly Ln Unit 6
- 255 N Polly Ln
- 251 N Polly Ln
- 251 N Polly Ln Unit 4